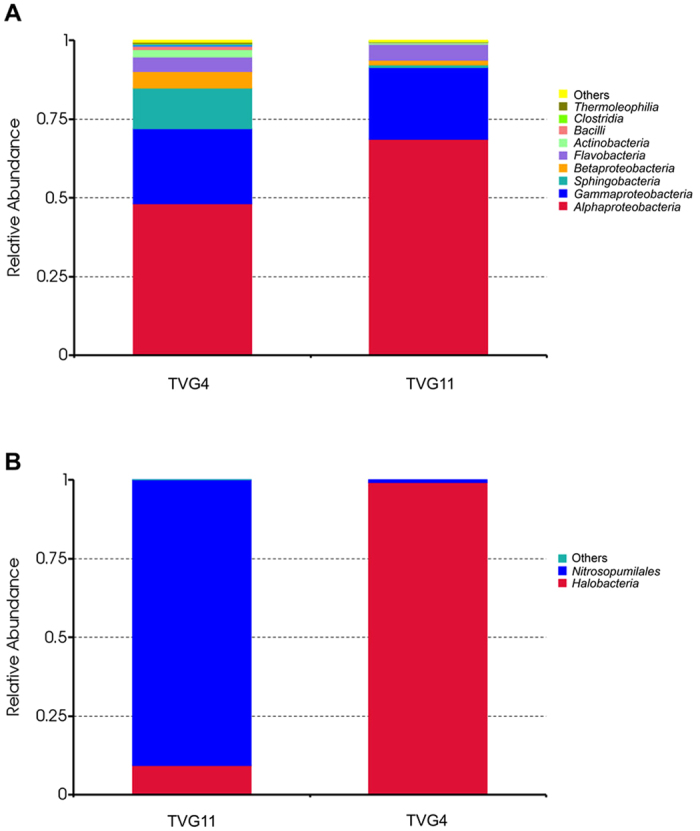
Figure 4.

Relative abundance of bacteria (A) and archaea (B) at the class level. Each color represents the percentage of the class in the total effective tags of each sample.

Relative abundance of bacteria (A) and archaea (B) at the class level. Each color represents the percentage of the class in the total effective tags of each sample.