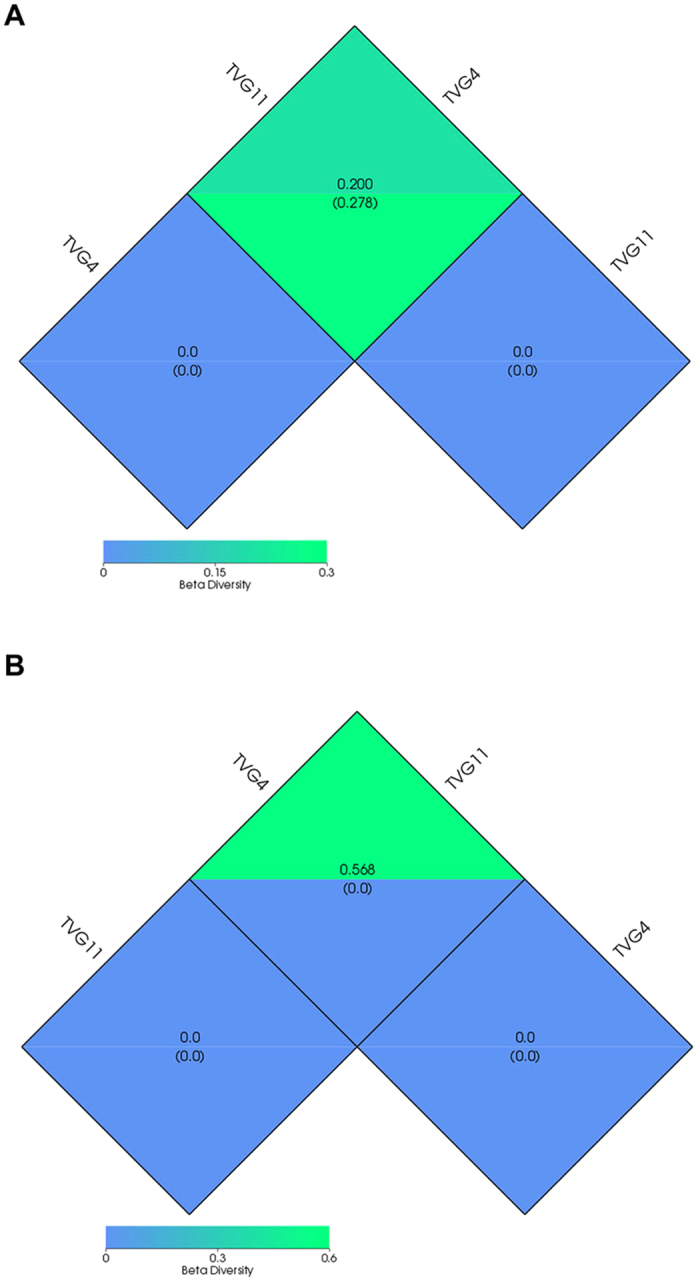
Figure 6. Beta diversity index of the bacterial and archaeal communities in the two samples.

Beta diversity index were measured based on weighted Unifrac and unweighted Unifrac distances. The upper and under numbers in the grid represents the weighted Unifrac and unweighted Unifrac distances, respectively. (A). Beta diversity index for bacterial communities; (B). Beta diversity index for archaeal communities.
