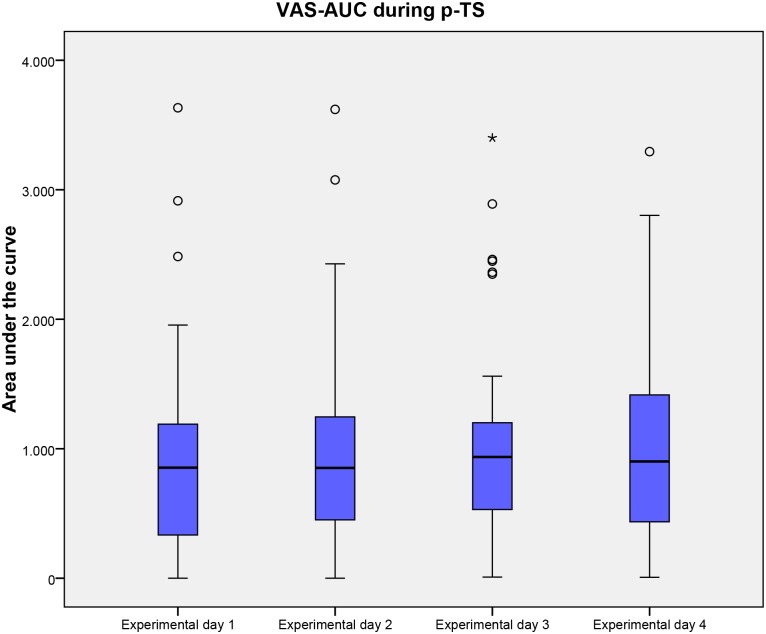
Fig 6. VAS-AUC during p-TS.
Visual analogue score during 1 min. thermal stimulation on the 4 experimental days. Medians and interquartile ranges are displayed. Values higher than 1.5 times of upper quartile or lower quartile are designated as outliers and marked with °. Abbreviations: VAS, Visual analogue score; p-TS, Pain during 1 min. thermal stimulation; AUC, Area under the curve.

