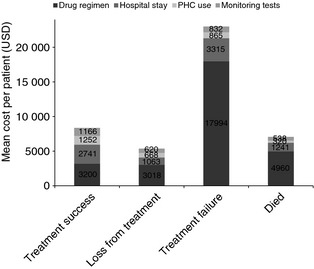
Figure 3.

Comparison of mean cost‐by‐cost category between patients with different treatment outcomes. PHC, primary health care; USD, US dollars.

Comparison of mean cost‐by‐cost category between patients with different treatment outcomes. PHC, primary health care; USD, US dollars.