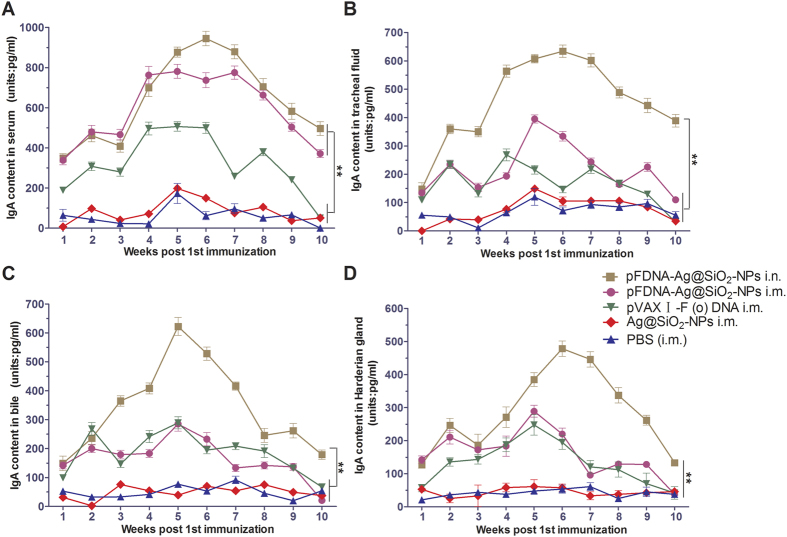
Figure 5.
IgA antibody titers in serum (A), tracheal fluid (B), bile (C), and Harderian gland (D) of SPF chickens immunized with the PBS i.m., blank Ag@SiO2-NPs i.m., plasmid pVAX I-F (o) DNA i.m., pFDNA-Ag@SiO2-NPs i.m., and pFDNA-Ag@SiO2-NPs i.n. IgA antibody titers in these samples were detected with ELISA. Data are presented as the mean ± standard deviation (n = 3). “**” indicates statistically significant difference at P < 0.01.

