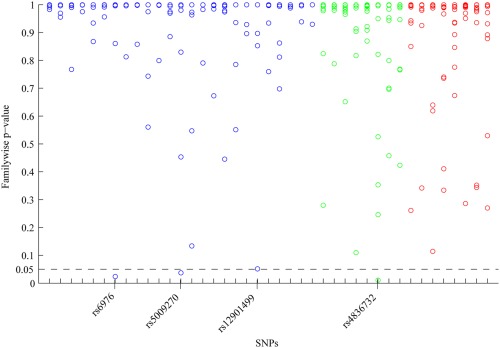
Figure 2.

Familywise P values for all 492 tests (41 single‐nucleotide polymorphisms [SNPs], 12 statistical shape model [SSM] modes) for association between univariate SSM modes of the proximal femur and candidate SNPs. All familywise P values are before adjustment for covariates and were obtained by running 100,000 permutations. The expected level for significance was a familywise P value of less than 0.05, which is indicated by the dashed line. Three SNPs (rs6976, rs5009270, and rs4836732) reached this significance level and 1 SNP (rs12901499) was just above it. Every SNP was tested following an additive genetic model in the stratum where the original association had been found (i.e., mixed‐sex [blue], female [green], or male [red]).
