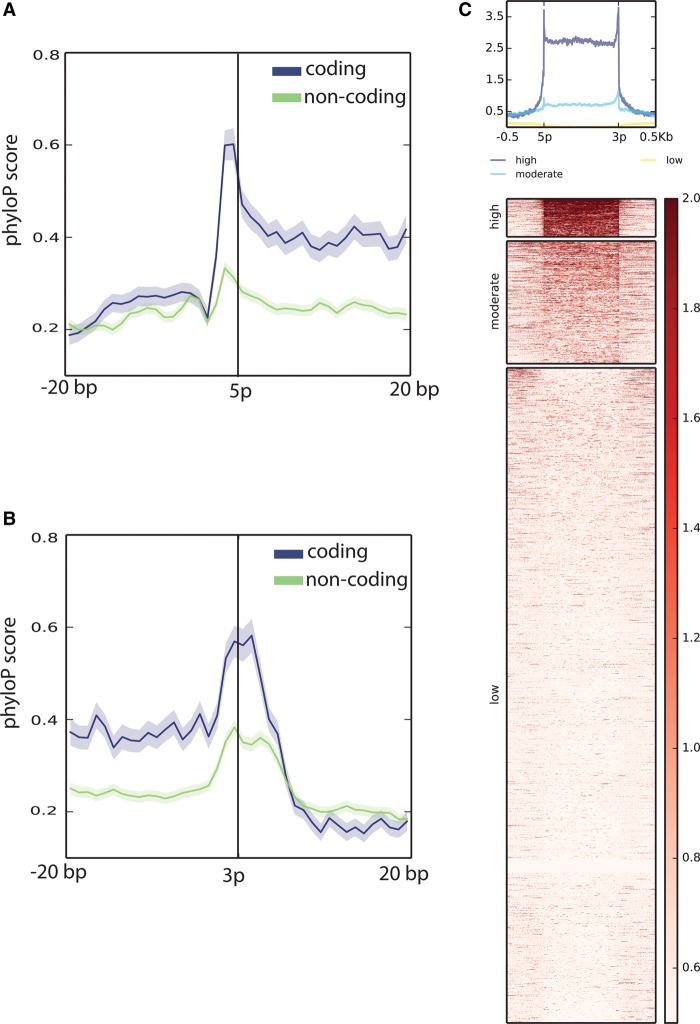
Figure 2.
Evolutionary conservation of HQ spliced exons not overlapping previous exon annotations on either strand. 5′ (A) and 3′ (B) ends of the exons. The vertical axis shows the mean phyloP conservation score (Pollard et al. 2010), which measures the conservation of each single nucleotide independently of its context. The shading indicates the standard error. Coding exons are shown in blue. The expected ORF triplet pattern (Clark et al. 2015) is noticeable as a series of conservation peaks. Noncoding exons are shown in green. For both coding and noncoding exons, conservation spikes are visible on the two first nucleotides outside the exons, suggesting the presence of conserved splice donor/acceptors. Exons are labeled as coding if the CPAT predicted ORF coverage is >70%. Exons are labeled as noncoding if the CPAT predicted ORF coverage is <20%. Exons with ORF coverage between 20% and 70% are not shown in A and B. In C, each row of the heatmap represents an exon plus 500 bp upstream of and downstream from the 5′ and the 3′ ends. Each exon is scaled to fit to a region of 1000 bp. Each row is divided into bins of 1 bp. The color of each bin reflects the mean phyloP vertebrate conservation. The heatmap shows a scale of colors saturating below 0.5 and above 2. Missing data are set to a score of 0. The three divisions of the heatmap reflect the k-means clustering. The rows are sorted in descending order considering the mean value in each row. The bar on the right of the heatmap indicates the scale range. The profile on top recapitulates the mean conservation score at the level of each bin.

