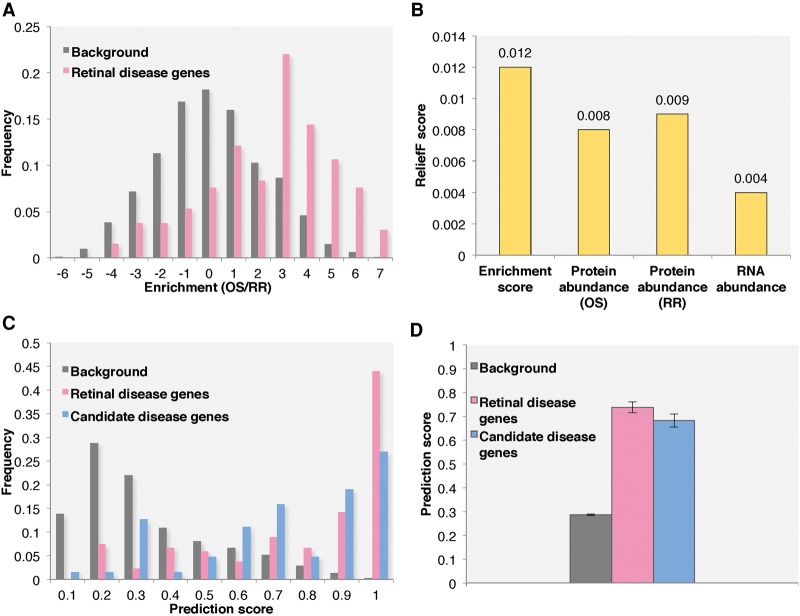
Figure 4.
Integrative method was applied to predict novel retinal disease genes. (A) The enrichment score distribution of all retinal disease and background proteins identified in the OS and RR proteomes. (B) The attribute importance, measured by ReliefF score, of all attributes used during machine learning. (C) The prediction score distributions for background genes, known retinal disease genes, and candidate disease genes. (D) The average prediction scores of background genes, known retinal disease genes, and candidate disease genes. All other genes identified in the OS and RR proteome are used as background.

