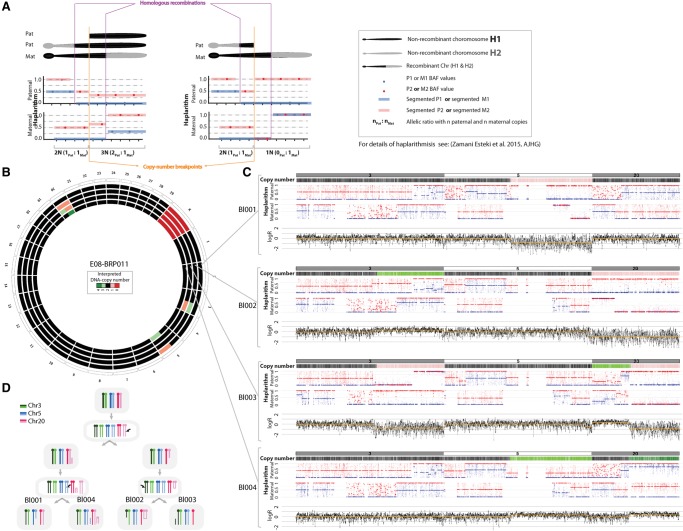
Figure 2.
Haplarithmisis unveils segmental imbalances across the genome. (A) Expected haplarithm patterns for segmental duplication (left) and deletion (right) of paternal in origin. For a detailed overview of haplarithmisis, see Zamani Esteki et al. (2015). (B) A Circos plot representing interpreted copy number imbalances for each cell. (C) siCHILD-determined profiles for Chr 3, Chr 5, and Chr 20. In each panel from top to bottom, respectively, we depict the interpreted copy-number profile, the paternal and maternal haplarithms, and the normalized logR-values. (D) A model illustrating how the detected segmental aberrations may arise.

