Figure 1.
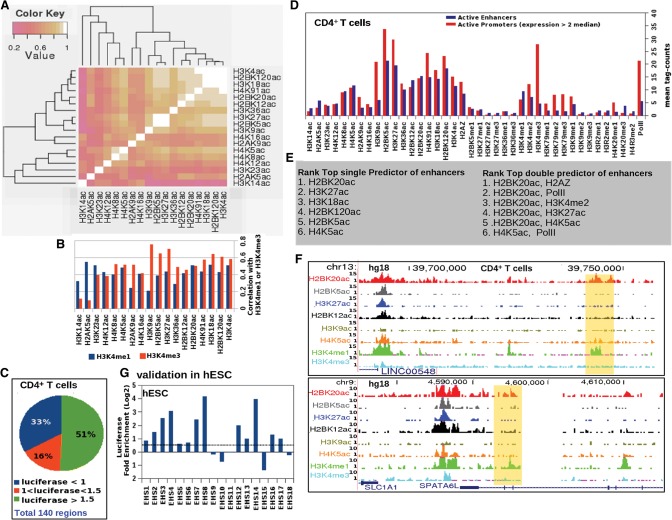
Distinct chromatin signatures of active enhancers and promoters. (A) Heatmap of Pearson correlation coefficients between ChIP-seq signals for 18 histone acetylation marks at open chromatin sites in CD4+ T cells. (B) Bar graph of correlation between 18 acetylation marks with H3K4me1 and H3K4me3 ChIP-seq signals at open chromatin regions in CD4+ T cells. (C) Distribution of enhancer activity of tested open chromatin regions in luciferase assays. (D) Enrichment over genomic background of 40 ChIP-seq signals at active promoters and validated enhancers in CD4+ T cells. (E) Ranked list of top predictors of active enhancers (based on logistic regression). (F) Examples of validated CD4+ T cell enhancers (highlighted in yellow) marked by H2BK20ac but not by H3K27ac. (G) Enhancer assay results from testing 18 genomic regions marked by H2BK20ac in H1 human embryonic stem cells (hESCs). Candidate regions were chosen randomly from among the top 20,000 H2BK20ac ChIP-seq peaks in H1-hESCs.

