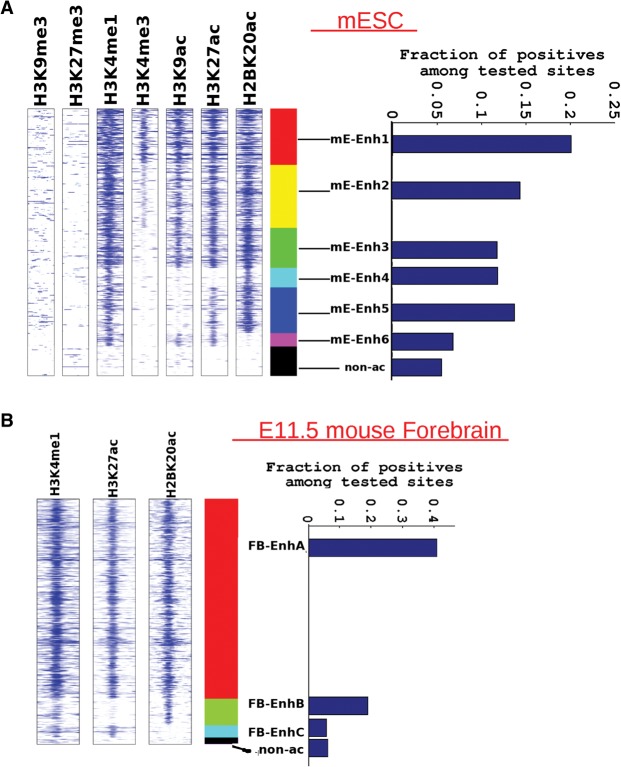
Figure 4.
Evaluating regulatory activity of different enhancer classes in reporter gene assays in mESCs and e11.5 mouse forebrain. (A) Spatial heatmap of histone-acetylated regions genome wide, showing six enhancer classes in mESCs. Flanking regions’ width in spatial heatmap is 4 kb, and number of Enh4 regions is ∼1200. Each class represents a distinct combination of the seven examined histone marks. In this case, the ChIP-seq peak-calling threshold was lowered to 1 × 10⁻⁴ so as to detect the mE-Enh6 class, which was marked by H3K27ac in the absence of H2BK20ac (∼800 mEenh6 regions). Bar graph shows the success rate of tested regions from each enhancer class in the massively parallel FIREWACh enhancer assay (Murtha et al. 2014). Nonacetylated regions tested in the enhancer assay (non-ac) are shown as a control. The number of tested elements overlapping different enhancer classes is as follows: mE-Enh1:1603, mE-Enh2:1397, mE-Enh3:761, mE-Enh4:227, mE-Enh5:574, mE-Enh6:204. (B) Similar spatial heatmap showing three enhancer classes in e11.5 mouse forebrain, again with a peak-calling threshold of 1 × 10⁻⁴. There are ∼1700 FB-EnhB regions (H2BK20ac and H3K4me1) and ∼850 FB-EnhC sites (H3K27ac and H3K4me1). Bar graph shows the success rate of tested regions from each enhancer class in LacZ reporter gene assays in e11.5 mouse forebrain (VISTA Enhancer Browser). The control set is smaller in this case since only a few non-ac regions were tested in mouse embryos. The number of tested regions from each enhancer class is as follows: FB-EnhA:515, FB-EnhB:21, FB-EnhC:17.

