Figure 2.

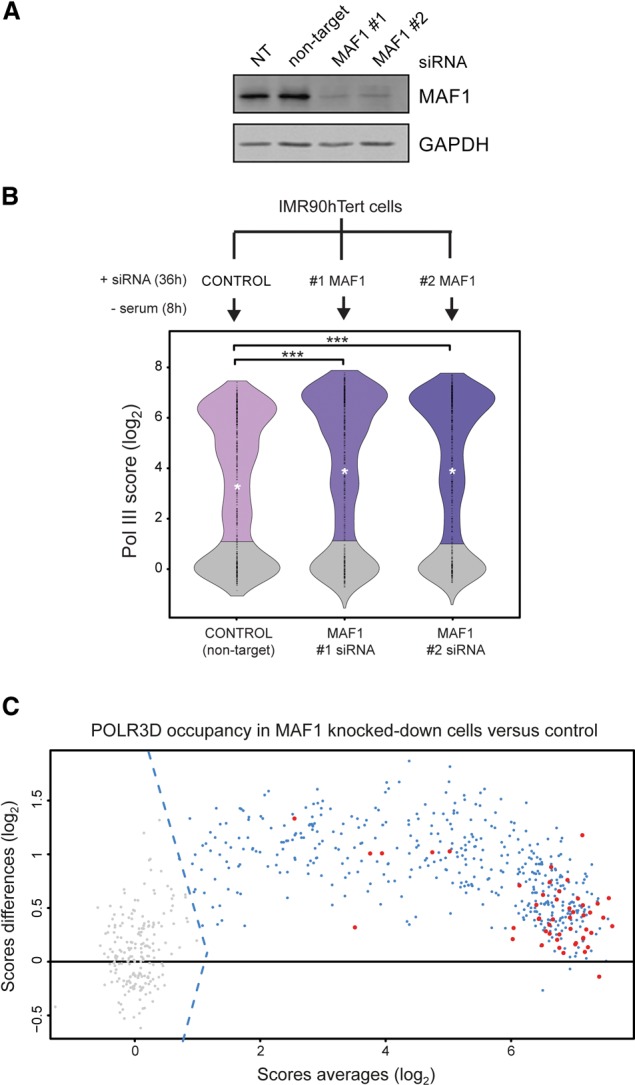
Pol III recruitment is controlled genome-wide by MAF1 in an mTORC1-dependent manner. (A) Depletion of MAF1 by RNAi. Immunoblots of IMR90hTert cells that were not transfected (NT) or were transfected with a control (nontarget) siRNA or with two MAF1-specific siRNAs (#1 and #2), and serum-starved for 8 h. (B) Violin plots showing distributions of Pol III ChIP-seq scores from IMR90hTert cells transfected as described in A. Nonoccupied genes are in gray. The median is in each case represented by a white asterisk. Data were analyzed with Wilcoxon pairs tests. (***) P < 0.001. (C) MA-plot comparing Pol III occupancy scores in MAF1 knockdown cells (mean of #1 and #2 MAF1 siRNAs) versus the control (#NEG siRNA). Gray dots left of the dotted lines (indicating the cutoff threshold score) represent nonoccupied genes. The horizontal line indicates the zero-fold change. Red dots indicate stable genes as defined in Pol III ChIP-seq experiments.
