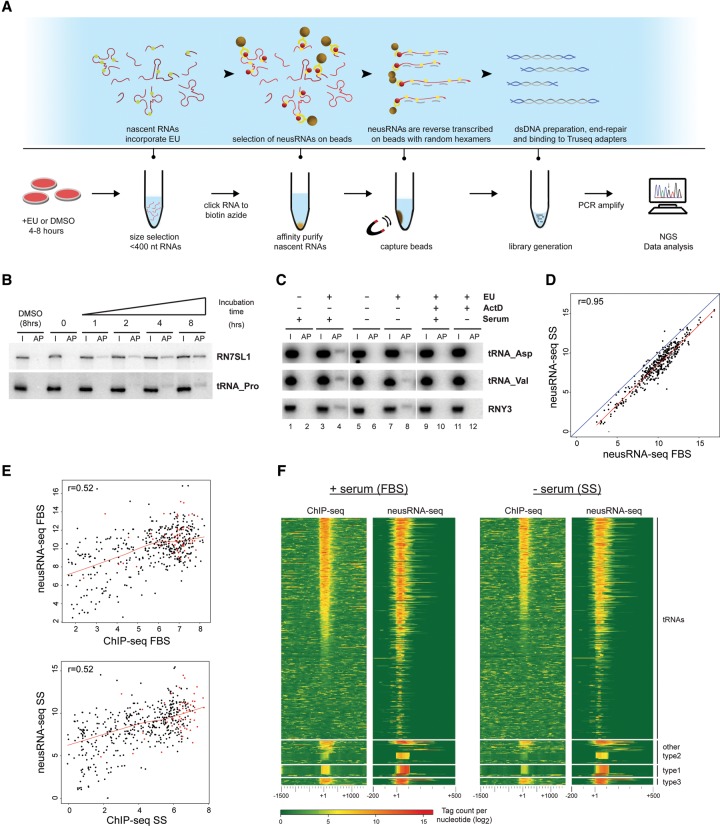
Figure 3.
neusRNA-seq reveals correlation between Pol III enrichment and expression during stress conditions. (A) Outline of the neusRNA-seq protocol. (B,C) Northern blot analysis showing time-dependent, cotranscriptional incorporation of 5-ethynyl uridine (EU) into Pol III–transcribed RNAs. Probes identify EU-labeled RNAs from the RN7SL1 and RNY3 genes or multiple tRNAs from a collection of proline (tRNA-Pro), aspartate (tRNA-Asp), and valine (tRNA-Val) isoacceptor tRNA genes. In B, DMSO (8 h) or 0.25 mM EU was added to cell media for the indicated times. In C, RNA from IMR90hTert cells grown in the presence or absence of serum (5 h) was pulse labeled with 0.25 mM EU for 5 h. 5 μg/mL actinomycin D (actD) was added where noted. (I) Twenty percent input RNA; (AP) streptavidin bead affinity purified EU-labeled RNAs. (D) Scatterplot comparing levels of EU-labeled Pol III–transcribed RNAs in different growth conditions (+ serum vs. −serum). (E) Scatterplots showing correlation of ChIP-seq and neusRNA-seq scores at Pol III–enriched loci for both serum-grown (upper panel) and serum-starved (lower panel) IMR90hTert cells. Red dots indicate genes defined as “stable” in Pol III ChIP-seq experiments. The Pearson correlation coefficient (r) is given. (F) Heatmaps showing correlation of Pol III binding (left) with gene transcription levels measured by neusRNA-seq (right). Pol III genes are split by promoter type and ranked by Pol III occupancy scores in the FBS sample. The heatmaps show sequencing read intensity centered on the annotated 5′ of genes (which for tRNA genes correspond to the 5′-end of the mature tRNA) and extending ±1.5 kb for ChIP-seq or −0.2/+0.5 kb for neusRNA-seq. Negative scores are set to zero.

