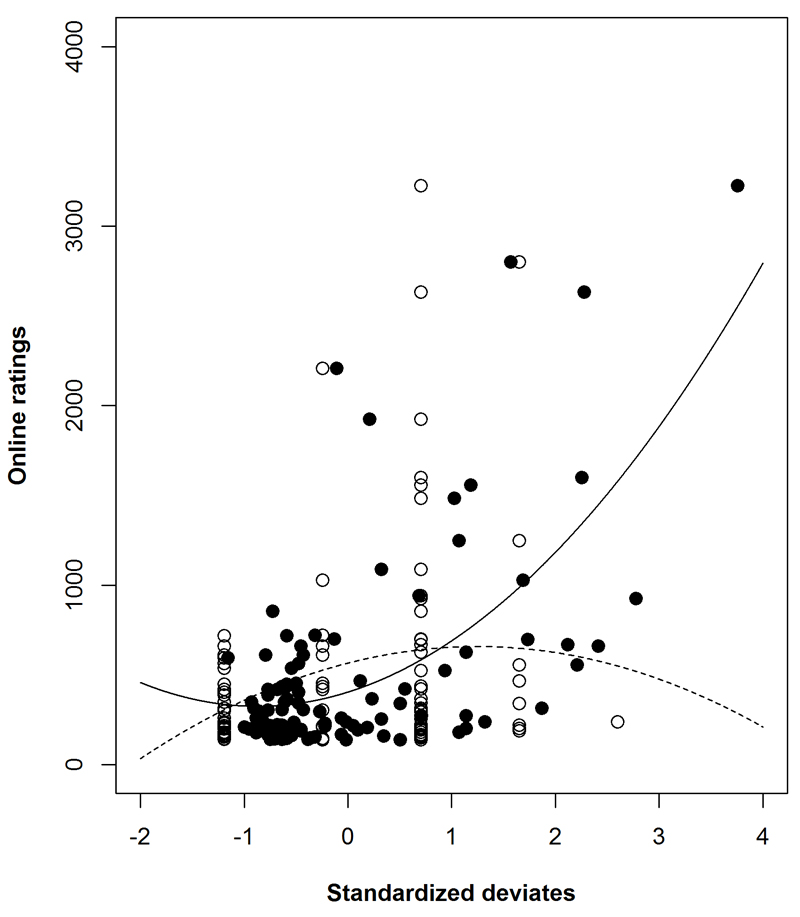
Fig. 4.
Ratings for individual jokes plotted against standardized normal deviates for intentionality rating (open symbols and dashed line) and word length (filled symbols and solid line). Standardized deviates (Z-scores) have been used to scale both measures so their effects can be compared directly. The regression lines are the best fit quadratic relationships.

