
Figure 5.
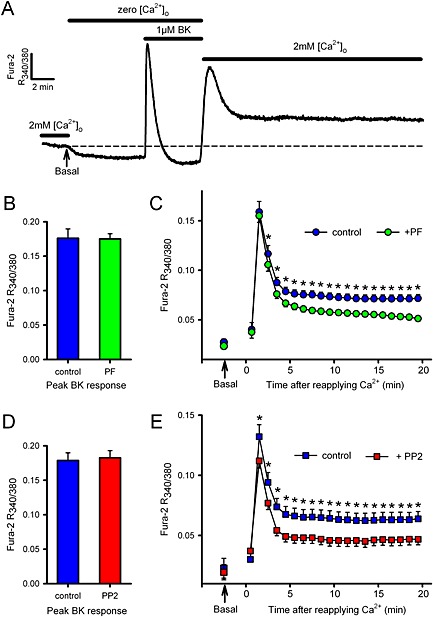
Effects of SrcFK and FAK inhibitors on SOCE/ROCE‐associated [Ca2+]i responses in hASMC. A: Representative control trace of [Ca2+]i in Fura‐2 loaded hASMC, as determined by the ratio of fluorescence at 340 nm/380 nm. Arrow indicates the point at which pre‐stimulus basal [Ca2+]i was recorded in 2 mM [Ca2+]o (and extrapolated by dashed line). The buffer was then switched to zero [Ca2+]o until a new baseline was established, and 1 μM BK added for 5 min. Finally, 2 mM [Ca2+]o was reapplied for 20 min. Responses were performed either in the absence or presence of FAK inhibitor PF‐573228 (B, C: PF, 10 μM, added 5 min prior to BK, n = 15 vs. 15 matched controls) or SrcFK inhibitor PP2 (D, E: 30 μM, added 5 min prior to BK, n = 10 vs. eight matched controls). Measurements were made of the peak BK‐induced transient (B, D: arbitrary units, mean ± SEM) and of the response to reapplication of 2 mM [Ca2+]o (C, E: arbitrary units, measured at 1 min intervals, mean ± SEM), compared with the pre‐stimulus basal [Ca2+]i in 2 mM [Ca2+]o (indicated by arrows). Background fluorescence (in zero [Ca2+]o, prior to the application of BK) was subtracted from all other measurements. Comparisons by un‐paired t‐test (B, D) or two‐way ANOVA with Holm–Sidak post tests (C, E: *P < 0.05 vs. matched controls).