
Figure 6.
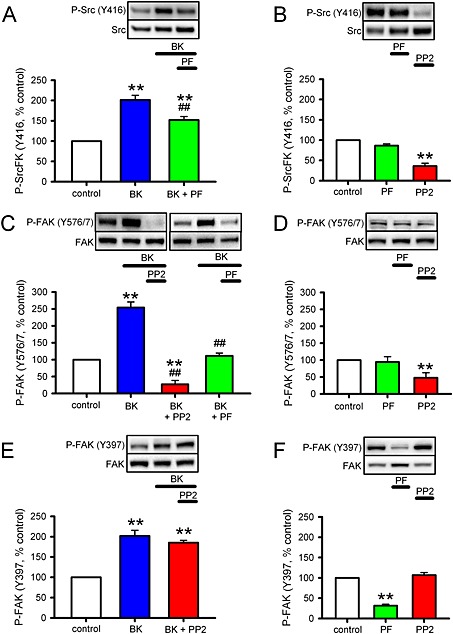
Interaction between SrcFK and FAK in response to BK in hASMCs. Measurements of auto‐phosphorylation of SrcFK at Y416 (P‐SrcFK, A, B), phosphorylation of FAK at the Y576/577 dual site (C, D), and auto‐phosphorylation of FAK at Y397 (P‐FAK, E, F) in hASMC. Representative blots show effects of treatments on ‘phospho’ and ‘total’ immunoreactivity for each protein. Bar charts show the effects of treatments on the degree of phosphorylation (mean ± SEM), expressed as a % of values from untreated (control) samples run on the same gels. (A) Effects of BK (1μM, 30 s) on P‐SrcFK (Y416) in the absence (n = 14) or presence of the FAK inhibitor PF‐573228 (PF, 10μM 10 min, n = 7). (B) Effects of PF (n = 4) or the SrcFK inhibitor PP2 (30μM, 10 min, n = 4) on basal P‐SrcFK (Y416). (C) Effects of BK on P‐FAK (Y576/577) in the absence (n = 11) or presence of PP2 (n = 6) or PF (n = 7). (D) Effects of PF (n = 4) or PP2 (n = 5) on basal P‐FAK (Y576/577). (E) Effect of BK on P‐FAK (Y397) in the absence (n = 14) or presence of PP2 (n = 4). (F) Effects of PF (n = 4) or PP2 (n = 4) on basal P‐FAK (Y397). Comparisons by one‐way ANOVA with Holm–Sidak post tests: **P < 0.01 versus control or ##P < 0.01 versus BK alone.