
Figure 2.
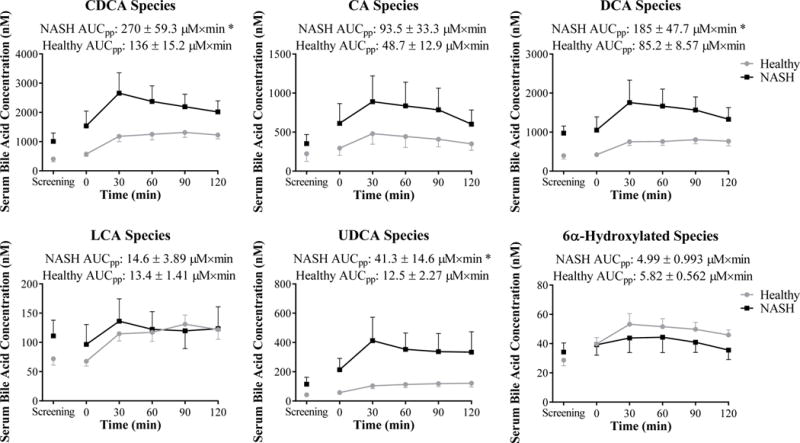
Serum bile acid species at screening and on study day depicted as concentration vs. time profiles in healthy subjects (grey circles, n=15) and patients with NASH (black squares, n=7). Post-prandial exposure calculated as the area under the serum concentration-time profile from 0–120 min (AUCpp) is reported. Data are presented as mean (nM or μM×min) and standard error of the mean. *p<0.05 NASH vs. Healthy