
Figure 4.
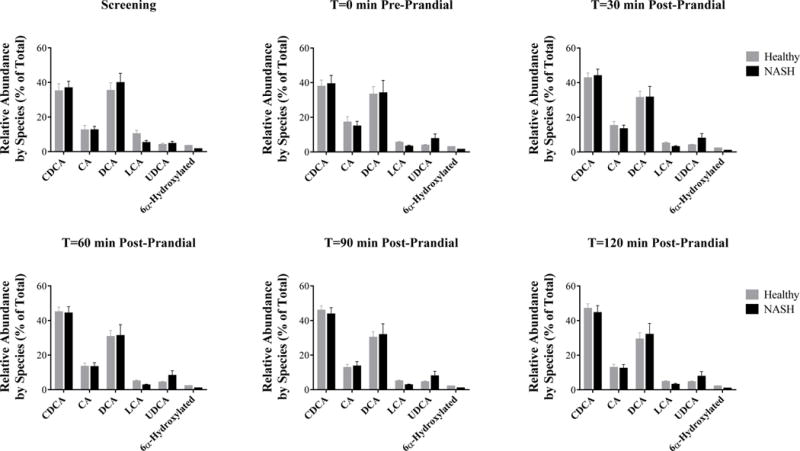
Relative abundance of bile acids in healthy subjects (grey, n=15) and patients with NASH (black, n=7) as a percentage of total serum bile acid concentrations. Data are presented as mean (%) and standard error of the mean.
Official websites use .gov
A
.gov website belongs to an official
government organization in the United States.
Secure .gov websites use HTTPS
A lock (
) or https:// means you've safely
connected to the .gov website. Share sensitive
information only on official, secure websites.
Relative abundance of bile acids in healthy subjects (grey, n=15) and patients with NASH (black, n=7) as a percentage of total serum bile acid concentrations. Data are presented as mean (%) and standard error of the mean.