Figure 5.
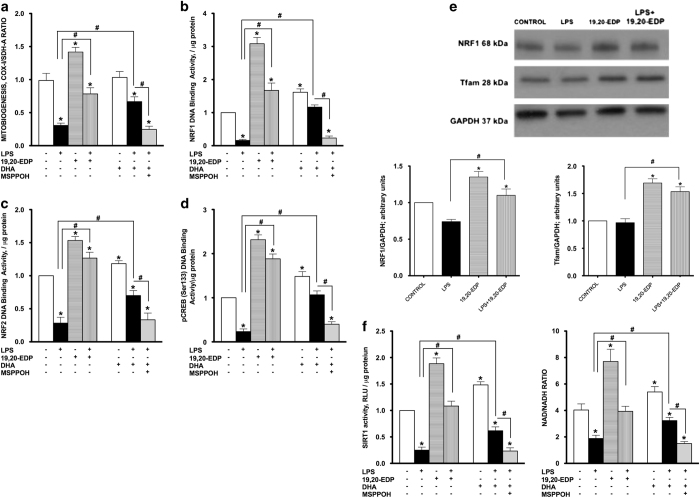
EDPs induce mitobiogenesis in HL-1 cardiac cells. HL-1 cardiac cells were stimulated with LPS (1 μg/ml) in the presence of 19,20-EDP (1 μM), DHA (100 μM) and/or MSPPOH (50 μM) for 24 h. (a) Relative rates of mitobiogenesis were assessed using ELISA detecting simultaneous expression of SDH-A (nDNA-encoded protein) and COX-I (mtDNA-encoded protein) in each well of plated HL-1 cells. The ratio between COX-I and SDH-A expressions represents the relative rate of mitobiogenesis. (b) NRF1 DNA-binding activity was measured in the whole-cell lysates using ELISA. (c) NRF2 DNA-binding activity was measured in the whole-cell lysates using ELISA. (d) pCREB (Ser133) DNA-binding activity was measured in the whole-cell lysates using ELISA. (e) Whole-cell lysates were harvested and then analyzed by western immunoblotting for the levels of key transcriptional regulators of mitobiogenesis. Representative western blots and the results of quantification are demonstrated. (f) SIRT1 activity was measured in the whole-cell lysates by bioluminescent assay in the presence of trichostatin A (1 μM). And the levels of NAD and NADH were determined in the cells by bioluminescent assay. Values are represented as mean±S.E.M. N=3 independent experiments. *P<0.05 treatment versus vehicle control; # P<0.05 treatment group versus LPS or LPS/MSPPOH.

