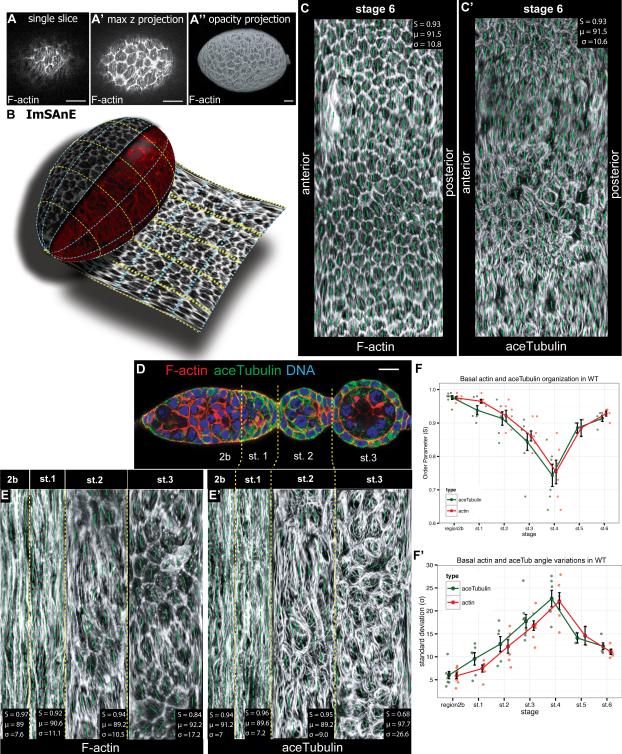
Figure 2. Germarial PCP revealed by ‘unrolling’ algorithm.
(A) Phalloidin-stained st. 6 follicle, shown in (A) single confocal section at basal surface, (A’) maximum intensity projection of confocal stack, and (A”) 3D opacity projections. (B) Diagram of ImSAnE unrolling of the basal surface of the follicle. (C) ImSAnE unrolling of stage 6 follicle stained with phalloidin and (C’) anti-acTub. Nematic order parameters (quantitated in upper left) demonstrate PCP organization. (D) Confocal cross-section of germarium stained with phalloidin (red) and anti-acTub (green). (E) ImSAnE unrolling of region 2b through stage 3 basal surface of ovariole in D. (F) Nematic order quantitation of MTs demonstrate dynamics of PCP organization in the germarium and early follicle. Data for Actin and acetylated Tubulin is shown to the immediate left and right (respectively) of each stage. Scale bars: 10μm.

