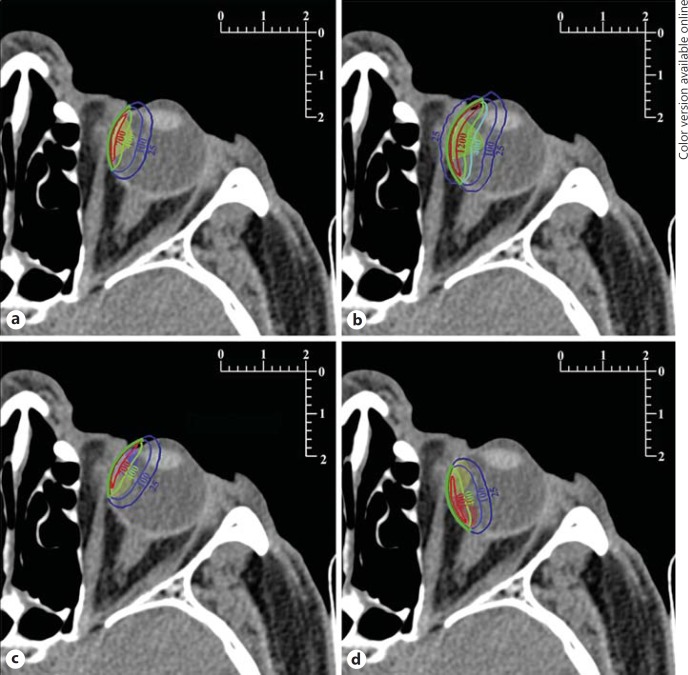
Fig. 1.
Isodose lines plotted on the slice coplanar with the plaques' symmetry axes. Metric scales are in centimeters. The cross-sections of the plaques are drawn in green (colors in online version only) with the emitter layers in red. The labels of the isodose lines are given in gray (Gy). Tumors are shown as translucent areas. Other tumor sizes can be inferred by the reader using the accompanying metric scales. a Equatorial 3-mm tumor treated centrically with the CCA plaque. b Equatorial 6.5-mm tumor treated centrically with the CCB plaque. c Equatorial 3-mm tumor treated eccentrically from the anterior position with the CCA plaque; the anterior tumor is also shown. d Equatorial 3-mm tumor treated eccentrically from the posterior position with the CCA plaque; the posterior tumor is also shown.

