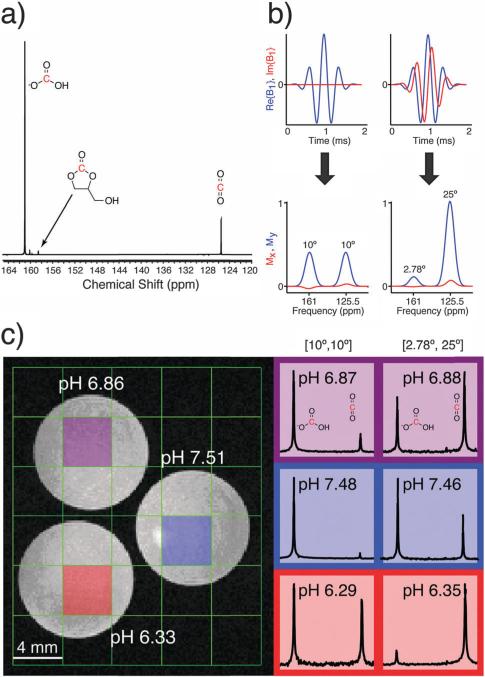
Fig. 2.
(a) Representative 13C NMR spectrum of HP 13C-GLC after hydrolysis. The 13C-GLC peak is referenced to 158.6 ppm. (b) Excitation pulses and simulated frequency profiles used for co-localizing HCO3– and CO2 at 14 T. The degree of excitation of each resonance (bicarbonate : CO2) was in the ratio of 1 : 1 (left) or 1 : 9 (right) (c) pH phantom results at 14 T: (left) T2-weighted 1H image, with electrode-measured pH values in white; (right) HP 13C spectra and calculated pH values for each color-coded voxel in left image. Spectra were obtained using an excitation pulse from (b), as indicated above each column.

