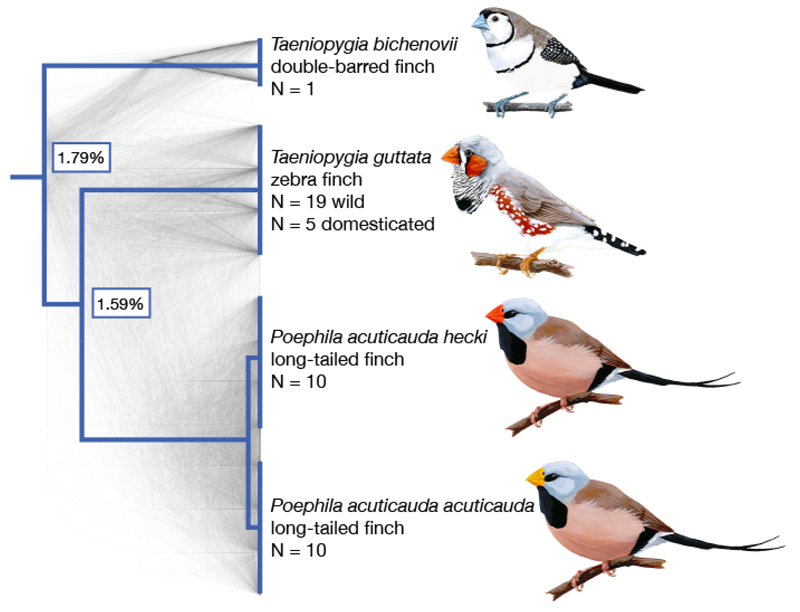
Figure 1.
Species tree for the finch species in this study. Species sampled were double-barred finch (Taeniopygia bichenovii), zebra finch (T. guttata), and the two long-tailed finch subspecies (Poephila acuticauda hecki and P. a. acuticauda). Tree rooted with medium ground finch and collared flycatcher (Geospiza fortis and Ficedula albicollis; full phylogeny shown in Fig. 4). Shown in gray are 1000 gene trees, which were used to infer the species tree (18). The pairwise divergence between species is indicated at nodes, as measured by the genome-wide average across autosomes. Images of birds from Wikimedia Commons.

