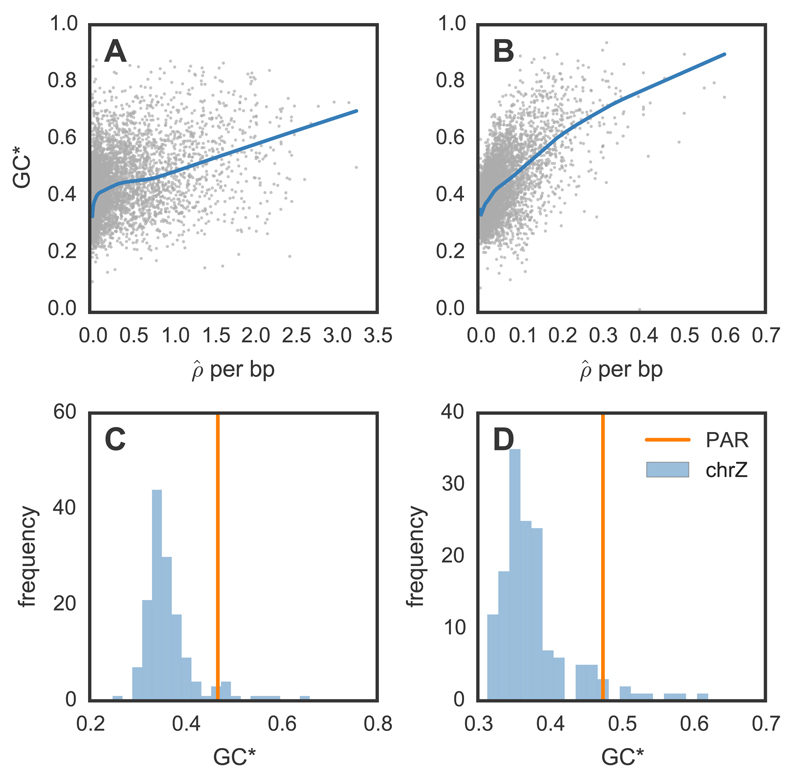
Figure 3.
Equilibrium GC content and broad-scale recombination rates in zebra finch (A, C) and long-tailed finch (B, D). (A-B) Relationship between equilibrium GC content [GC*; 18]) and /bp for zebra finch and long-tailed finch across all autosomal chromosomes. Both GC* and were calculated across 50 kb windows with LOESS curves shown for span of 0.2. (C-D) GC* and the pseudoautosomal region (PAR). The histogram shows GC* for chromosome Z across 500 kb windows; GC* for the 450 kb PAR shown by the vertical line.

