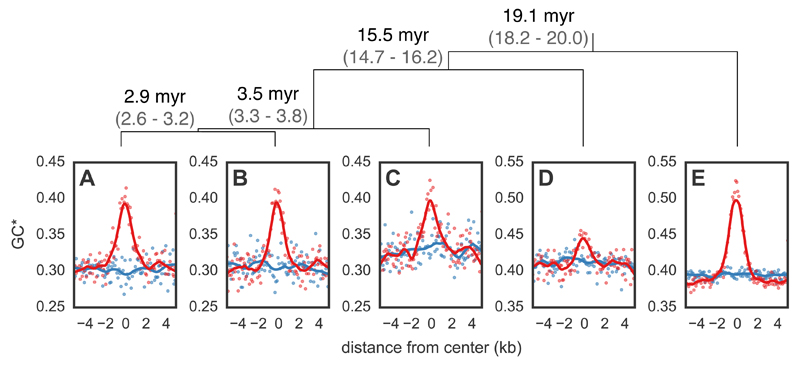
Figure 4.
Expected equilibrium GC content (GC*) around hotspots and matched coldspots for five bird species. Points (hotspots shown in red and coldspots in blue) represent GC* estimated from the lineage-specific substitutions aggregated in 100 bp bins from the center of all hotspots in (A) zebra finch and (B) long-tailed finch. GC* for (C) double-barred finch, (D) medium ground finch, and (E) collared flycatcher was calculated around hotspots identified as shared between zebra finch and long-tailed finch. LOESS curves are shown for a span of 0.2. The orientation of hotspots is with respect to the genomic sequence. Species tree (18) shown with estimated divergence times in millions of years (myr) and its 95% Highest Posterior Density in gray; top.

