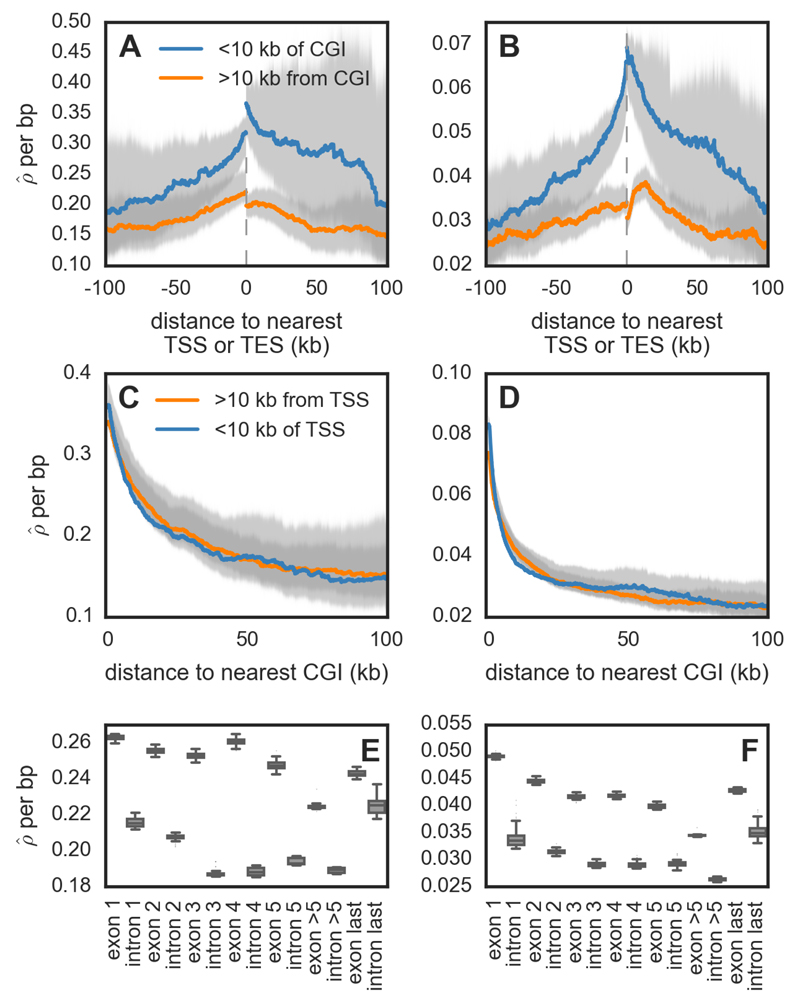
Figure 5.
Recombination rates across genomic features for zebra finch (A, C, E) and long-tailed finch (B, D, F). (A-B) Estimated recombination rates (/bp) around annotated transcription start sites (TSSs) and end sites (TESs), conditional on whether they are within 10 kb of a CpG island (CGI) or not. The gray dotted line represents the location of the gene, and the distances are shown accounting for the 5' → 3' orientation of genes. (C-D) shown as a function of distance to nearest CGI, conditional on whether the CGI is within 10 kb of an annotated TSS or not. See Fig. S17 for the pattern of CGIs relative to TESs. For figures A – D, uncertainty in rate estimates (shown in gray) was estimated by drawing 100 bootstrap samples and recalculating means. (E-F) within exons and introns for genes that have ≥5 exons (n=7,131). See Fig. S28 for simulation results that suggest the inference of higher background in exons does not reflect differences in diversity levels between exons and introns.

