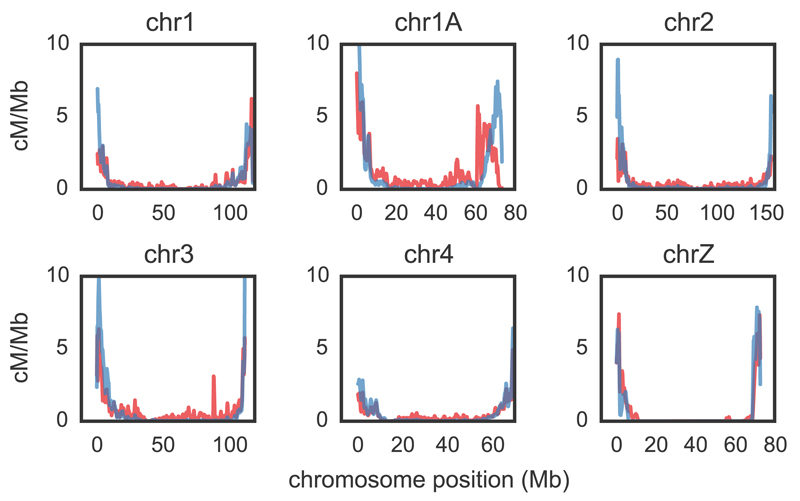
Figure 6.
Comparative recombination rates for zebra finch and long-tailed finch. Zebra finch rates shown in red; long-tailed finch in blue. Estimated rates [cM/Mb; obtained from /bp (18)] are shown as rolling means calculated across 100 kb windows. We show here the five largest autosomal chromosomes and chromosome Z; see Fig. S20 for all chromosomes. Rate estimates for chromosome Z should be taken with caution for both biological and technical reasons (see 18 for more information).

