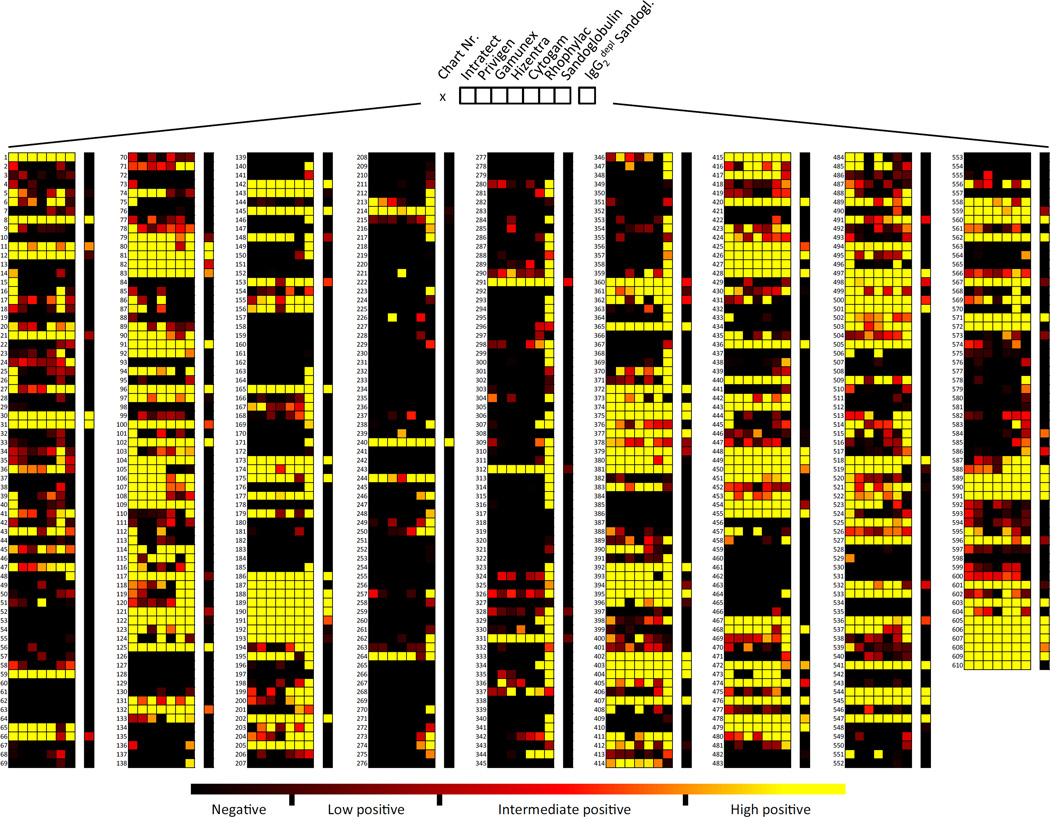
Fig. 1. Comprehensive heat map depicting IgG antibody binding activities of IVIG/SCIG preparations to the 610 printed glycans on Consortium for Functional Glycomics (CFG) glycan array version 5.1.
Each column represents a specific IVIG/SCIG preparation, each row an individual glycan. Color code with computed categorization of binding intensity is indicated, as outlined in the Materials and methods section.

