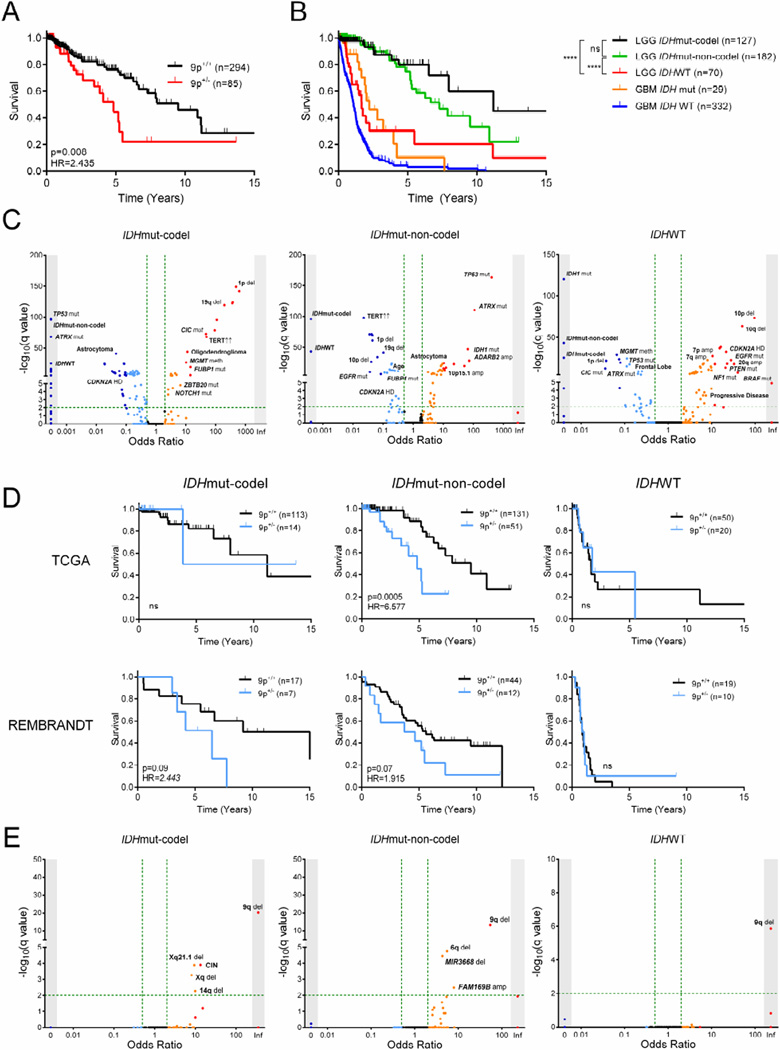
Figure 2. Characterization of LGG test cohorts.
(A) Kaplan-Meier curve showing survival outcome for 9p loss in the TCGA LGG cohort.
(B) Kaplan-Meier curve showing survival outcome in TCGA LGG and GBM cohorts by subtype and IDH status, respectively. ****, p<0.0001; ns, not significant.
(C) Clinical and molecular variables in LGG and their association to LGG subtype. Fisher’s exact test −log10(q value) (y-axis) and odds ratio (x-axis) for association are shown. Arrows indicate increased mRNA expression.
(D) Kaplan-Meier curves showing survival outcome for 9p loss in both TCGA and REMBRANDT LGG cohorts by subtype.
(E) Clinical parameters and molecular events associated with 9p loss in the TCGA LGG cohort by subtype. Fisher’s exact test −log10(q value) (y-axis) and odds ratio (x-axis) for association are shown.
Mut, mutant; codel, 1p/19q codeletion; LGG, lower grade glioma; WT, wild-type; GBM, glioblastoma multiforme; HR, hazard ratio; del, deletion; amp, amplification; CIN, chromosomal instability; meth, promoter hypermethylation; HD, homozygous deletion.

