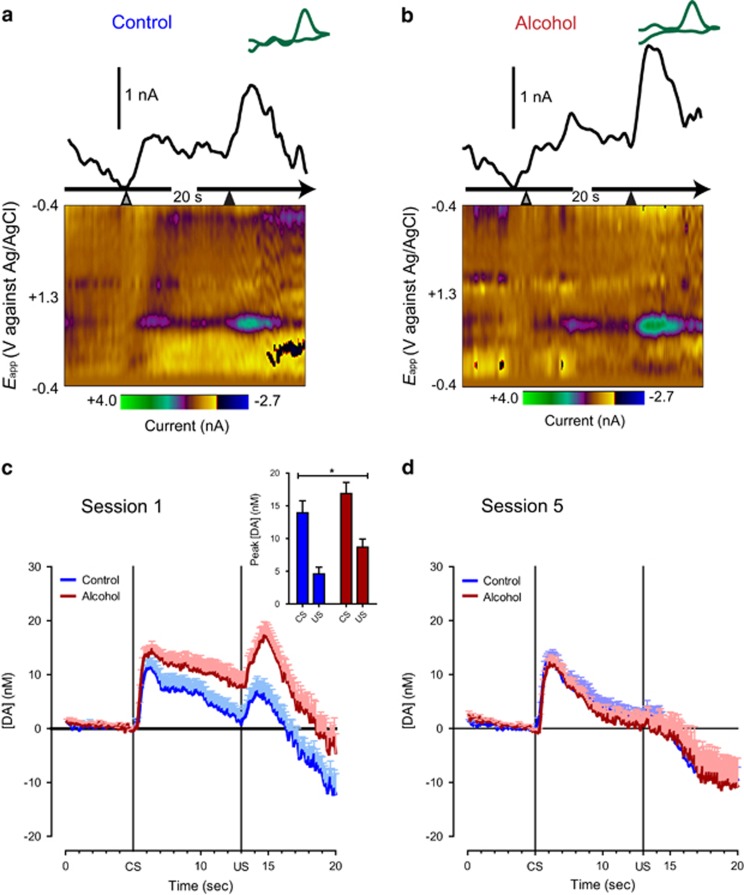
Figure 3.
Phasic dopamine signaling during the first and final sessions of Pavlovian conditioned approach behavior. (a, b) Representative traces from the first session and corresponding background-subtracted cyclic voltammograms (inset) depict changes in dopamine oxidative current within the nucleus accumbens core in response to CS presentation (grey arrowhead) after 5 s and US delivery (black arrowhead) after 13 s in control (a) and alcohol-exposed animals (b). The pseudocolor plots depict color-coded observed changes in redox currents as a function of applied potential (y axis) plotted over time (x axis). (c) Average trace of dopamine transmission in a 20-s window around CS and US presentation over the first 25 trials of Pavlovian conditioning. (c: inset) Peak dopamine values for CS and US responses for alcohol- and control-treated animals in the first Pavlovian session. (d) Average trace of dopamine transmission in a 20-s window around CS and US presentation over the final 25 trials of Pavlovian conditioning. Data are represented as means+SEM. *Difference between groups (one-way ANOVA, p<0.05).

