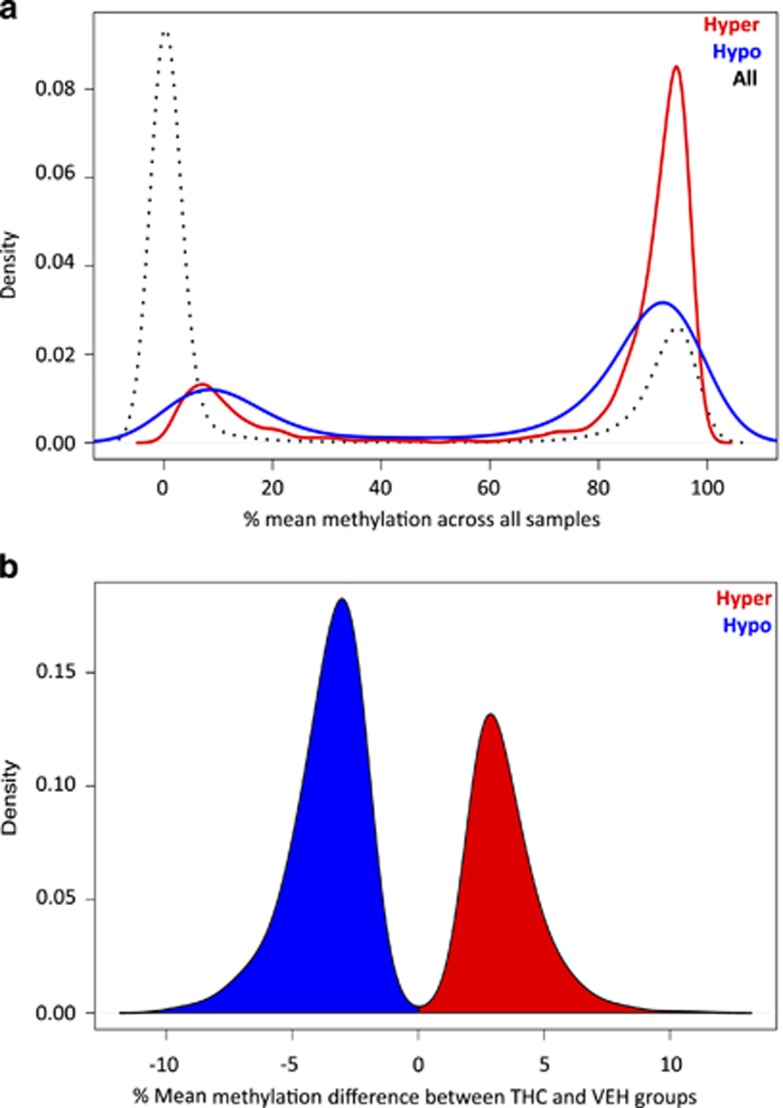
Figure 1.
Global features of CpGs associated with cross-generational effects of THC exposure. (a) Density of CpGs plotted against the estimated mean methylation values between 0 and 100% (calculated across all THC and VEH animals) from both the background CpG list (black; n=567,306), and the hypermethylated (red) and hypomethylated (blue) DMRs; CpGs within DMRs have higher methylation levels on average. (b) Density of significant CpGs (q<0.01) from hyper- and hypomethylated DMRs (n=3,758) plotted against the difference in mean methylation values observed between THC and VEH groups, with hypermethylated changes (between-group difference>0%) shown in red, and hypomethylated changes shown in blue. DMRs, differentially methylated regions; THC, tetrahydrocannabinol; VEH, control vehicle

