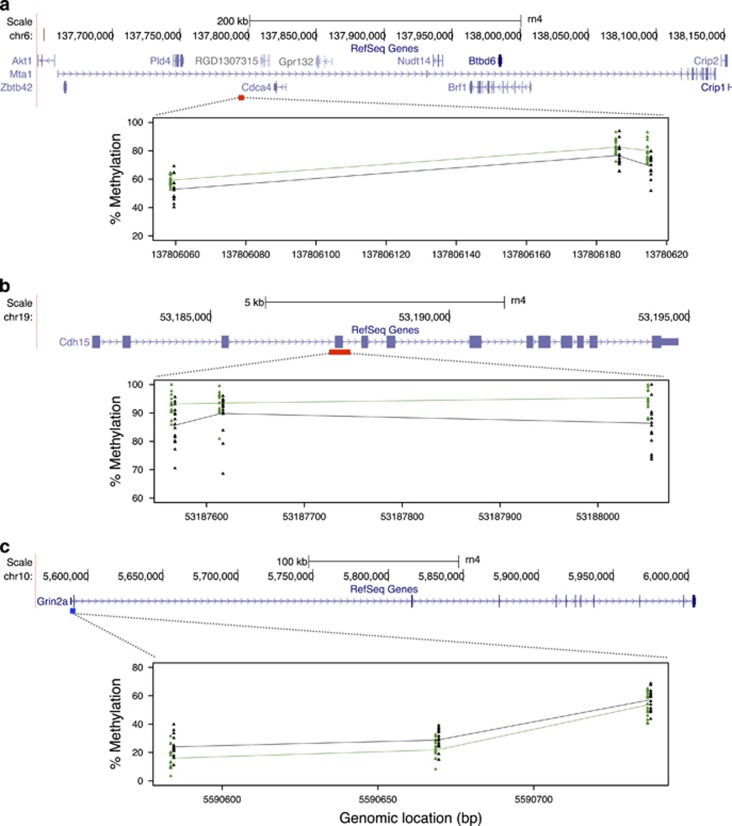
Figure 2.
Plots demonstrating consistent differences in mean methylation between THC and VEH groups across significant CpGs within: (a) a hypermethylated DMR within an intron of Mta1, showing only the three significant hypermethylated CpGs within the DMR; (b) a hypermethylated DMR identified spanning exon 3 of Cdh15, showing only the three significant hypermethylated CpGs within the region; and (c) a hypomethylated DMR residing in exon 1 of Grin2a, ~2.5 kbp downstream of the transcript start site. In each panel, a schematic of Refseq gene annotations for each loci are shown, with exons depicted as purple blocks. A scale bar and bp positions in the rat rn4 genome assembly are provided. The locations of each hyper- and hypomethylated DMRs are indicated under each gene by red and blue boxes, respectively. DMR plots are shown below each gene. Within each plot, clusters of colored triangles represent methylation values at a given CpG across all individuals (THC, green; VEH, black). The mean methylation values for THC and VEH groups are represented by solid green (THC) and black (VEH) lines, connecting each CpG position. Approximate CpG bp positions (rn4) are indicated on the x axis. DMR, differentially methylated region; THC, tetrahydrocannabinol; VEH, control vehicle.

