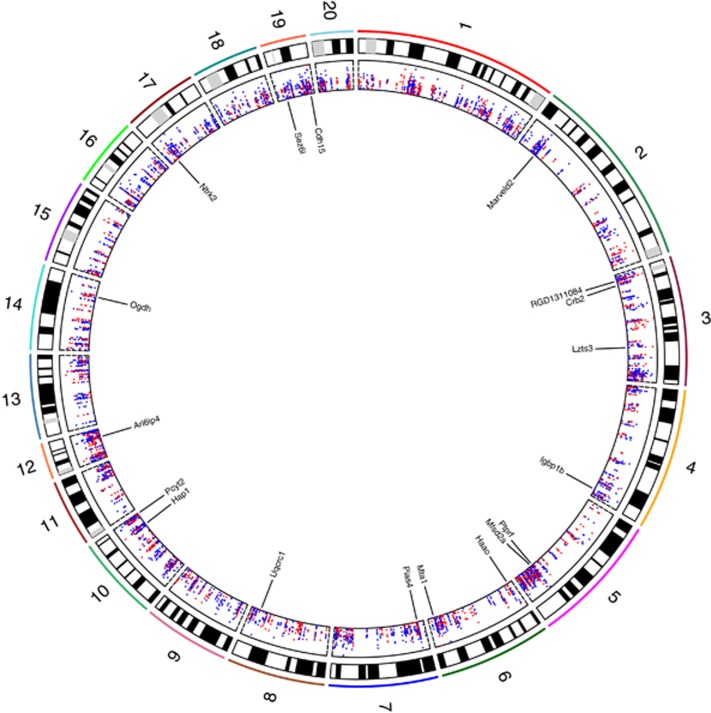
Figure 3.
A circos plot showing the positions of all CpGs (n=5611) within significant DMRs across autosomes (chr1–20). Absolute mean methylation differences between THC and VEH groups for each hypo- and hypermethylated CpG are shown in the inner most panel (scale, 0–12%) as blue and red dots, respectively. The locations and names of 18 Refseq genes overlapped by the top 30 DMRs (Table 1) are indicated. The plot was generated using Rcircos (Zhang et al, 2013). DMR, differentially methylated region; THC, tetrahydrocannabinol; VEH, control vehicle.

