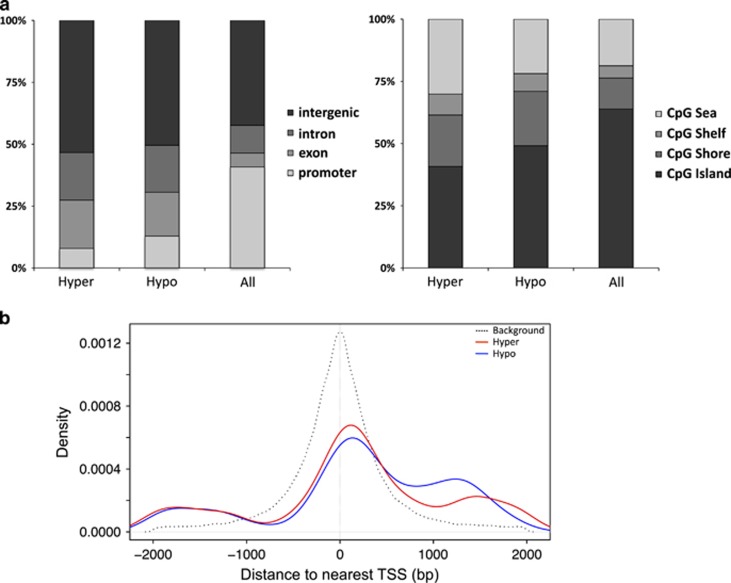
Figure 4.
Localization of CpGs with respect to exon/intron, promoter/TSS, and CpG island annotations in the rn4 genome. (a) The proportions of CpGs in hyper- and hypomethylated DMR (‘Hyper', ‘Hypo' n=5,611) and background sets (‘All' n=567,306) overlapping Refseq gene (left panel) and CpG island annotations (right panel). (b) Comparison of genomic distances (bp) from Refseq gene TSSs of promoter-associated CpGs within DMRs (n=612) and the background set (n=235 524), represented by red/blue and black lines; DMR-CpGs were preferentially located downstream of TSSs.DMR, differentially methylated region; TSS, transcription start site.

