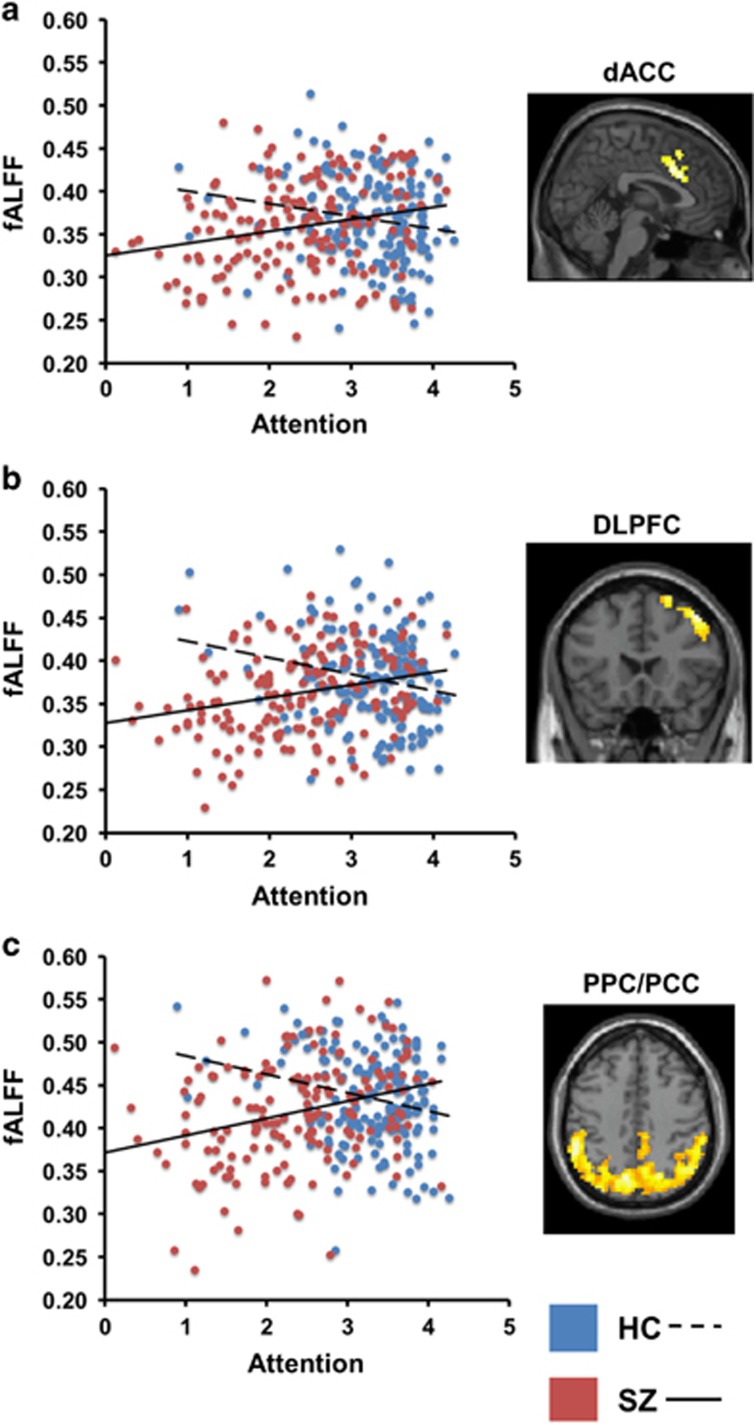
Figure 1.
Scatterplots and neuroanatomical regions showing significant fALFF–cognition slope differences between healthy control (HC) and schizophrenia (SZ) groups for the test of attention (CPT-IP d'). All findings are family-wise error cluster-level corrected at a p<0.01 height threshold. Regions shown: (a) dorsal anterior cingulate/supplementary motor area (dACC), x=3 mm; (b) right dorsolateral prefrontal cortex (DLPFC), y=21 mm; (c) bilateral medial and posterior lateral parietal cortex and posterior cingulate cortex (PPC/PCC), z=42 mm.

