. 2016 May-Aug;10(2):343–348. doi: 10.4103/0259-1162.181226
Copyright: © Anesthesia: Essays and Researches
This is an open access article distributed under the terms of the Creative Commons Attribution NonCommercial ShareAlike 3.0 License, which allows others to remix, tweak, and build upon the work non commercially, as long as the author is credited and the new creations are licensed under the identical terms.
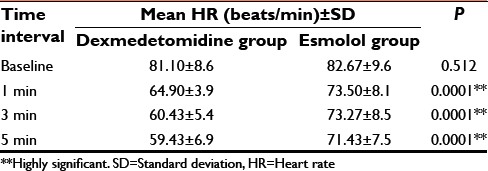
Table 3.
Comparison of mean HR between the groups