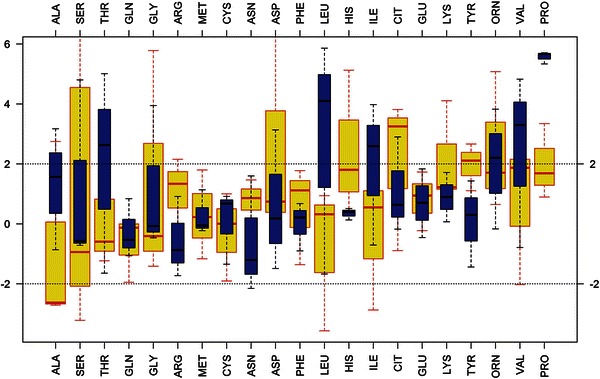
Fig. 1.

Box plots of age-normalized levels of 21 plasma amino acids for samples from patients with primary (yellow) or presumably secondary (blue) MAD deficiency at presentation. Y-axis: age-normalized standard deviations from a hospital reference population. Amino acids are ordered from the lowest (alanine, ALA) to the highest median levels (proline, PRO) across all samples. The boxes cover the ±25th percentile from the median (horizontal line in the boxes); the dotted lines cover the ±95th percentile from the median
