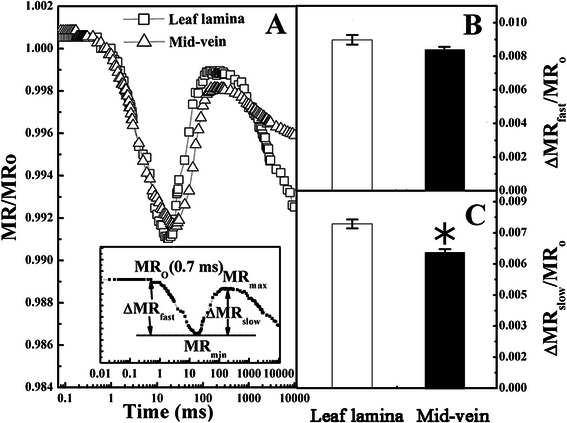
Fig. 6.

Mean kinetics of modulated reflection at 820 nm (MR). a MR was normalized and expressed by MR/MRO on logarithmic time scale from 0 ms to 10 s, where MRO was the value at 0.7 ms (taken at the onset of the red light illumination, the first reliable MR measurement). Each curve represents the average kinetics recorded from 15 independent measurements. The inserted graph showed the definition of characteristic parameters of the MR/MRO kinetics (MRmin, MRmax) according to Strasser et al. (2010), where MRmin was the minimal MR reached during the fast phase (i.e., between 0.7 ms and 10–200 ms) and MRmax was the maximal MR reached by the end of the slow phase (taken at 1 s). b Amplitudes of the fast phase: ΔMRfast/MRO = (MRO − MRmin)/MRO, which corresponds to the kinetics of the photo-induced changes in P700 redox state and the activated PSI RC (P700+). Mid-veins (△) and leaf laminae (□). c Amplitudes of the slow phase: ΔMRslow/MRO = (MRmax − MRmin)/MRO, which reflects P700+ re-reduction and connectivity of the two photosystems. Data are means ± SE from 15 independent measurements. The significant difference between two tissues (P < 0.05) is indicated by the asterisk
