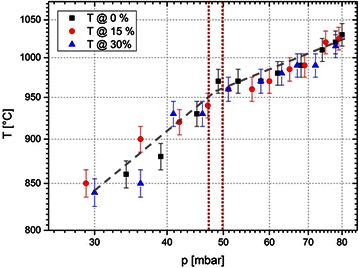
Fig. 3.

Substrate temperature as a function of the pressure at different methane concentrations. The substrate temperature for different methane concentrations is plotted as a function of the process pressure two different power laws can be identified by fitting the two regimes in a log/log-plot. The vertical dashed lines indicate the approximate transition region between the two regimes
