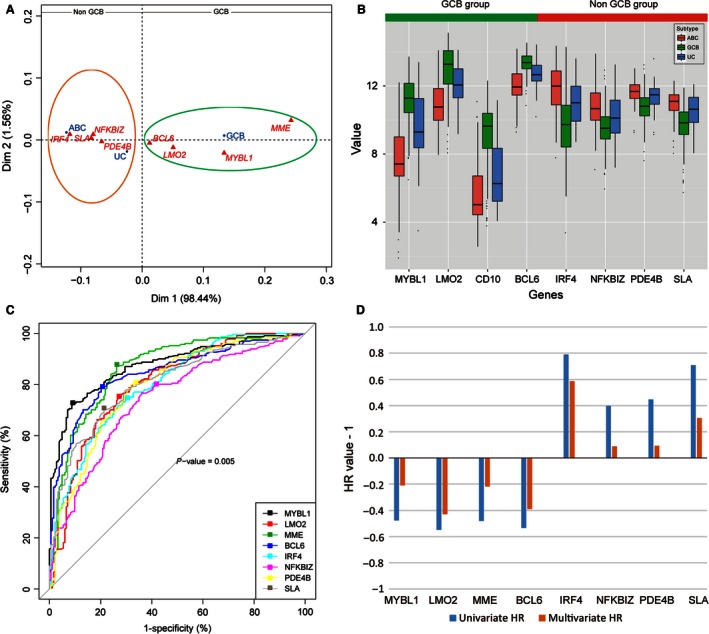
Figure 2.

Explore the eight significant genes' distribution with Correspondence Analysis (CA) and cutoff values with receiver–operating characteristic (ROC) analysis in GSE10846. (A) Plot of first and second axes (Dim 1*2) for the classification of diffuse large B‐cell lymphoma (DLBCL) subtypes and eight significant genes according to their variables. Projection of the variables in principal plane 1*2: the first and the second dimensions present, respectively, 98.44 and 1.56% of the total inertia. The sharps of the clouds suggest a repulsion between two groups (GCB and Non‐GCB) of variables. Group1: MYBL1, LMO2, BCL6, and MME seem to characterize GCB subtype patients in the factorial design (green circle). Group2: On the opposite side, the Non‐GCB patients were characterized by the presence of IRF4, PDE4B, NFKBIZ, and SLA (dark orange circle). (B) Different expression of eight significant genes were divided into two groups. Eight genes' expression levels in GCB, ABC, and unclassified (UC) subtype. Expression levels are presented as boxplots and were compared using the Mann–Whitney test and the Nemenyi test (all P‐values < 0.05). (C) Calculate the Youden index from the ROC curves. The points stand for cutoff values were identified corresponding to the maximum sensitivity and specificity to classify a DLBCL as GCB or Non‐GCB type according to Gene expression profiling (GEP) analysis. (D) Compare the hazard ratio (HR) of the eight genes from univariate analysis and multivariate analysis by using Cox regression. Both univariate and multivariate HR of four genes (MYBL1, LMO2, MME, and BCL6) were negative, and the left four genes (IRF4, NFKBIZ, PDE4B and SLA) were with positive value.
