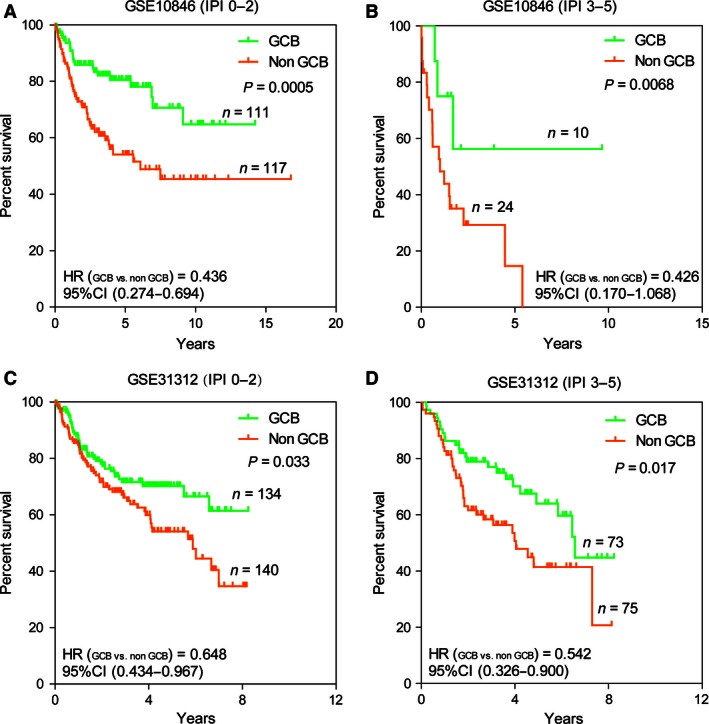
Figure 6.

The eight‐gene model and the International Prognostic Index (IPI). The Kaplan–Meier estimates showed overall survival for groups of patients with low IPI scores and high IPI scores after stratified as GCB or Non‐GCB subtype on basis of the eight‐gene model. According to log‐likelihood estimates, P = 0.0005 (A), 0.0068 (B) and P = 0.033 (C), 0.017 (D) for the model based on a continuous variable applied to the GCB and Non‐GCB groups shown in the figure, respectively.
