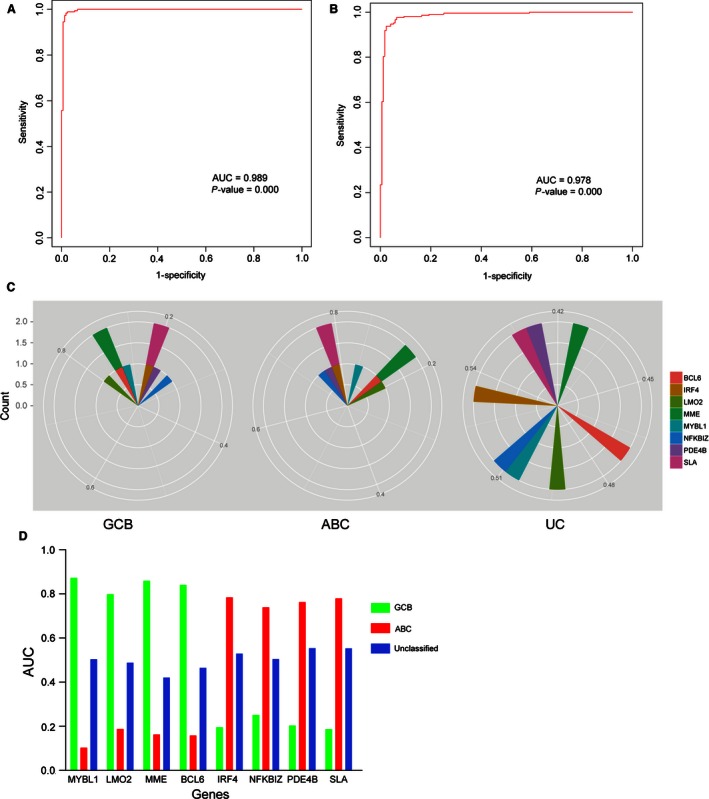
Figure 7.

Access the discriminatory accuracy of the SVM model and each marker with ROC curve analysis. (A, B) The ROC curve analysis evaluated the discriminant power with large AUC area for training data (0.989, P = 0.000) and validated data (0.978, P = 0.000). (C) Radar map method was used for analyzing the distribution of the AUC values of each gene marker in assigning cases to GCB, ABC or unclassified (UC) classification. (D) The performance of each marker could be quantified by the area under the ROC curve. Based on these parameters, MYBL1, LMO2, BCL6 and MME were the best marker for GCB subtype, and IRF4, PDE4B, NFKBIZ and SLA were more specific in recognizing ABC‐DLBCL.
