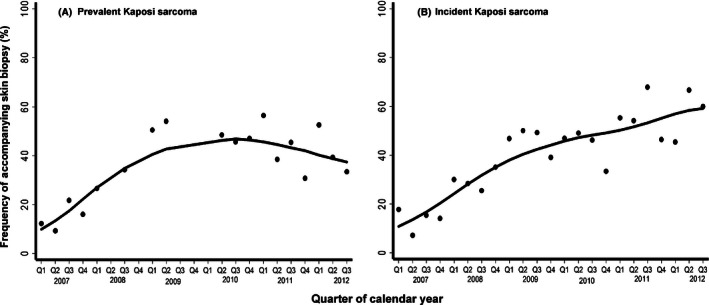
Figure 2.

Frequency of accompanying skin biopsy at the time of diagnosis of Kaposi sarcoma (KS) among HIV‐infected patients over time at three healthcare systems in East Africa. Panel A shows instances of prevalent KS diagnosis, and panel B shows cases of incident KS. Line represents locally weighted scatterplot smoothing (LOWESS). Q represents quarter of the calendar year.
