
Figure 2.
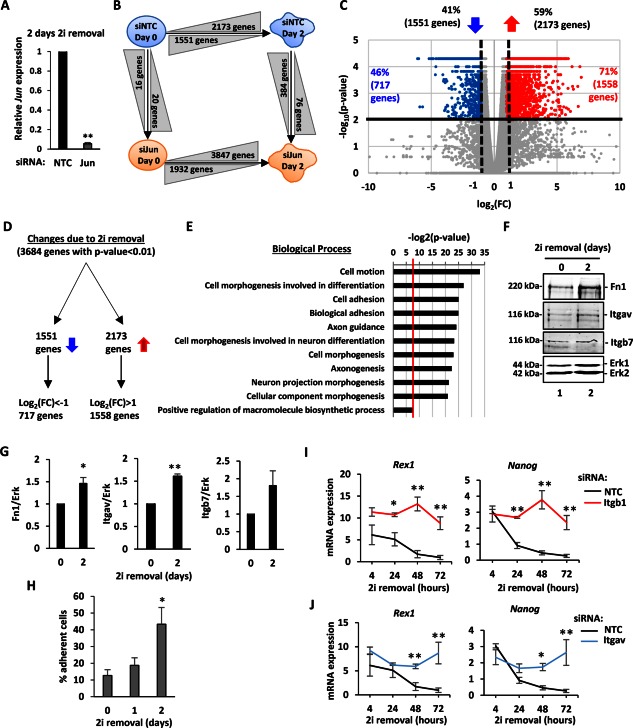
Upregulation of adhesion in differentiating embryonic stem cells (ESCs). (A): Reverse transcripton quantitative polymerase chain reaction (RT‐qPCR) analysis of the knockdown efficiency of Jun by siRNA treatment. RNA expression 2 days after 2i removal was measured and normalized against Gapdh and is relative to NTC (n = 3) (**, p < 01). (B): Schematic representation of the four conditions analyzed with an RNA‐seq experiment. Cells were treated with siRNA (either NTC, blue or against Jun, orange) and were released from the 2i inhibition for 2 days. RNA was collected either at day 0 (still in 2i) or at day 2 (n = 2). The arrows indicate the direction of the interaction studied. The number of genes that change between conditions are indicated in grey triangles, and triangles indicate the nature of the change: increasing height indicates upregulation, decreasing height indicates downregulation. A p value cut‐off of .01 was applied. (C): The gene expression changes due to the 2i withdrawal are represented with a volcano plot. On the x‐axis the FC is reported as log2(FC), and on the y‐axis the p value is reported as −log10(p value). The horizontal line represents the p value threshold set at .01. The numbers and percentages of downregulated (left) and upregulated (right) are indicated above the graph. Vertical dashed lines represent the thresholds of log2(FC) = 1 or of log2(FC) = −1. The percentage and number of genes with p value < .01 and log2(FC) either > 1 or < −1 are indicated in the corresponding parts of the graph and individual data points colored red (for significantly upregulated) and blue (for significantly downregulated). (D): Schematic representation of the partitioning of the gene expression changes. The directions of the blue arrows indicate upregulated and downregulated genes. (E): Gene ontology term enrichment analysis for genes upregulated upon 2i removal. The biological processes are reported on the y‐axis, and the significance of the enrichment is reported on the x‐axis as log2(p value). A p value cut‐off of .01 was applied (red vertical line). (F): Western blot analysis of Fn1, Itgav, and Itgb7 protein expression in ESCs in 2i (day 0 – lane 1) and 2 days after 2i release (day 2—lane 2). Erk was used as loading control. (G): Quantification of the protein abundance from the Western blot analysis in (E). The expression values were normalized against Erk. Error bars represent the SEM (n = 3) (*, p < .05; **, p < .01). (H): An adhesion assay was performed for ESCs cultured for the indicated times in the absence of 2i. The percentage of adherent cells is reported as cells attached compared to the NTC control. Error bars represent the SEM (n = 3) (*, p < .05). (I, J): RT‐qPCR analysis of Rex1 and Nanog expression upon Itgb1 (H; red lines) or Itgav knockdown (I; blue lines) in ESCs cultured in the absence of 2i for the indicated times. Mean expression values are reported and compared to the NTC condition (black lines). The mRNA level is expressed as relative to the geometric mean of the housekeeping genes (Gapdh, Ppia, Pgk1, Tbp, and Tubb5), and error bars represent SEM (n = 3, *, p < .05; **, p < .01). Abbreviations: FC, fold change; Fn1, fibronectin 1; Itgav, Integrin alpha V; Itgb7, Integrin beta 7; NTC, nontargeting control.