
Figure 3.
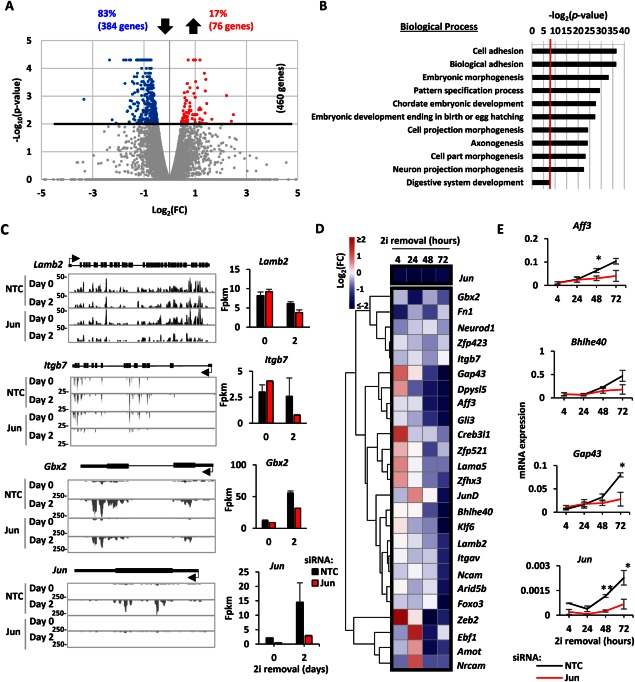
Contribution of Jun to embryonic stem cell (ESC) adhesion. (A): Volcano plot representation of the gene expression changes due to Jun knockdown as described in Figure 2B. In this case all the genes scored log2(FC) > 0.5 so no vertical threshold was applied. (B): Gene ontology Term analysis for the genes downregulated upon Jun removal. The biological processes are reported on the y‐axis, and the significance of the enrichment is reported on the x‐axis as log2(p value). A p value cut‐off of .01 was applied (red vertical line). (C): UCSC Genome Browser tracks for the indicated genes are reported as examples of the effect of Jun removal. The height, the time point (day 0 or day 2), and the condition (NTC or Jun siRNA treated) for each track are reported on the left. Gene structure is shown in black above the tracks (thick line = exons, thin lines = UTR, the arrow indicates the transcription start site [TSS], and the direction of transcription). On the right side the fpkm values for each gene are reported. Error bars represent the SEM (n = 2). (D): ESCs were treated with either NTC or Jun siRNA and released from the 2i inhibition. Gene expression was assessed at 4, 24, 48, 72 hours using the BioMark HD System (Fluidigm) as described in Figure 1C. (E): Examples of the expression profiles for the experiment in (D) are shown as described in Figure 1D. Error bars represent the SEM (n = 3) (*, p < .05; **, p < .01). Abbreviations: FC, fold change; fpkm, fragments per kilobase per million sequenced reads; NTC, nontargeting control; siRNA, small interfering RNA.