
Figure 4.
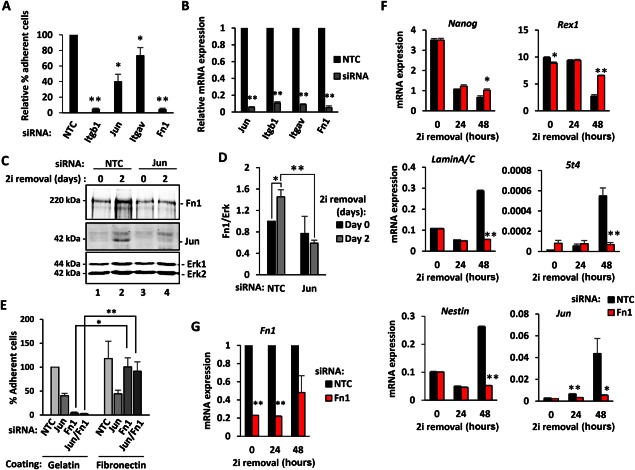
Jun regulates of embryonic stem cell (ESC) adhesion through Fn1. (A): Adhesion of cells is reported as percentage of adherent cells relative to control cells (NTC siRNA) upon Jun, Itgb1, Itgav, and Fn1 siRNA treatment. Error bars represent the SEM (n = 3) (*, p < .05; **, p < .01). (B): Knockdown efficiency of the experiment in (A) is shown. RNA expression was normalized against Gapdh and is relative to NTC (n = 3) (**, p < .01). (C): Western blot analysis of Fn1 expression in mouse ESCs at day 0 (lanes 1 and 3) or at day 2 (lanes 2 and 4) after 2i release. The effect of Jun removal (lanes 3 and 4) was compared to the NTC (lanes 1 and 2). Erk was used as loading control. (D): Quantification of Fn1 from the Western blot analysis described in (C). Fn1 expression was normalized against Erk levels and it is relative to NTC at day 0 (taken as 1). Error bars represent the SEM (n = 3) (*, p < .05; **, p < .01). (E): Adhesion of cells is reported as percentage of adherent cells relative to control cells (NTC siRNA) on gelatin coated plates, upon Jun, Fn1 or Jun and Fn1 siRNA treatment. Cells were grown on either gelatin or fibronectin coated plates. Error bars represent the SEM (n = 3) (*, p < .05; **, p < .01). (F, G): Reverse transcription quantitative polymerase chain reaction analysis of pluripotency and differentiation markers, Jun (E) and Fn1 (F) upon Fn1 knockdown (red bars) are shown and compared to the NTC condition (black bars). The mRNA level is expressed as relative to the geometric mean of the housekeeping genes (Gapdh, Ppia, Pgk1, Tbp, and Tubb5), and error bars represent SEM (n = 3, *, p < .05; **, p < .01). Abbreviations: Fn1, fibronectin 1; Itgav, Integrin alpha V; Itgb7, Integrin beta 7; NTC, nontargeting control; siRNA, small interfering RNA.