
Figure 5.
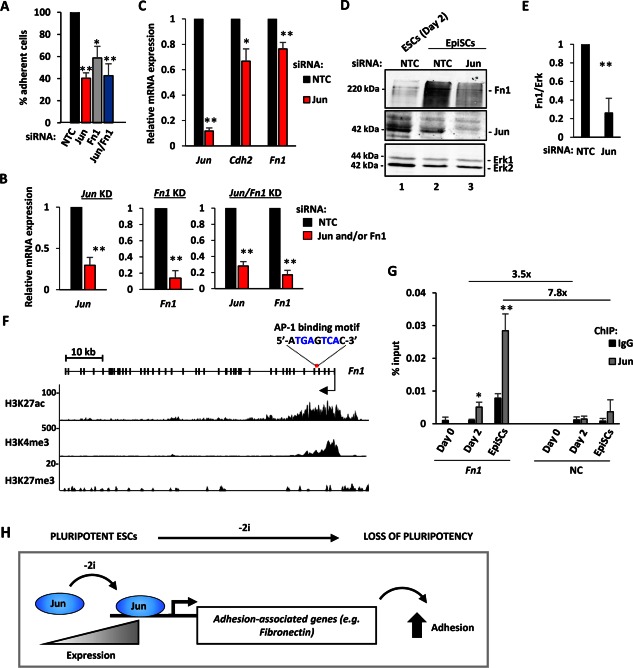
Contribution of Jun to adhesion of EpiSCs. (A): Adhesion of EpiSCs was tested upon Jun and Fn1 removal and is shown relative to NTC (taken as 100%). Error bars represent the SEM (n = 3) (*, p < .05; **, p < .01). (B): KD efficiency of Jun and Fn1 in the experiment described in (A). RNA expression was normalized against Gapdh and is relative to NTC (taken as 1) (n = 3) (**, p < .01). (C): Expression of the indicated genes in EpiSCs upon Jun removal. The mRNA level was normalized against the geometric mean of the housekeeping genes (Gapdh, Ppia, Pgk1, Tbp, and Tubb5) and is relative to the control (NTC siRNA) condition (equal to 1; dashed line). Error bars represent the SEM (n = 3) (**, p < .01). (D): Western blot analysis of Fn1 protein expression (top panel) in EpiSCs following NTC (lane 2) and Jun (lane 3) siRNA treatment. Cell lysate from ESCs at day 2 (NTC) was used as control (lane 1). Jun KD efficiency (middle panel) and Erk (loading control; bottom panel) are shown. (E): Quantification of Fn1 levels from the Western blot analysis described in (B). Fn1 expression was normalized against Erk and it is relative to NTC (taken as 1). Error bars represent the SEM (n = 3) (**, p < .01). (F): UCSC genome browser view of the Fn1 gene structure (exons are represented with thick lines and introns with thin lines; the arrow indicates the TSS and the direction of transcription). The AP‐1 motif identified with HOMER and MEME, and its position is indicated above the Fn1 gene. Primers for ChIP‐qPCR were designed around this motif. Histone modifications in ESCs (Yang et al. 19) are shown below. The type of histone modifications and the track height are indicated on the left. (G): ChIP‐quantitative polymerase chain reaction analysis of Jun binding (light grey) to the Fn1 locus in ESCs (day 0 and day 2 after 2i withdrawal) and EpiSCs. Pull down efficiency is expressed as % input and is compared to normal rabbit IgG control. Error bars represent the SD (n = 3) (*, p < .05; **, p < .01). The enrichment of Jun binding on Fn1 relative to a NC region and is reported in the top part of the graph. (H): Schematic representation of the findings. Jun levels increase as ESCs exit from ground state pluripotency, leading to the activation of a programme of genes associated with cell adhesion. This in turn contributes to the loss of pluripotency and the onset of the commitment and differentiation process. Abbreviations: AP‐1, activator protein‐1; ChIP, chromatin immunoprecipitation; EpiSC, epiblast stem cells; ESCs, embryonic stem cells; Fn1, fibronectin 1; KD, knockdown; NC, negative control; NTC, nontargeting control; siRNA, small interfering RNA.