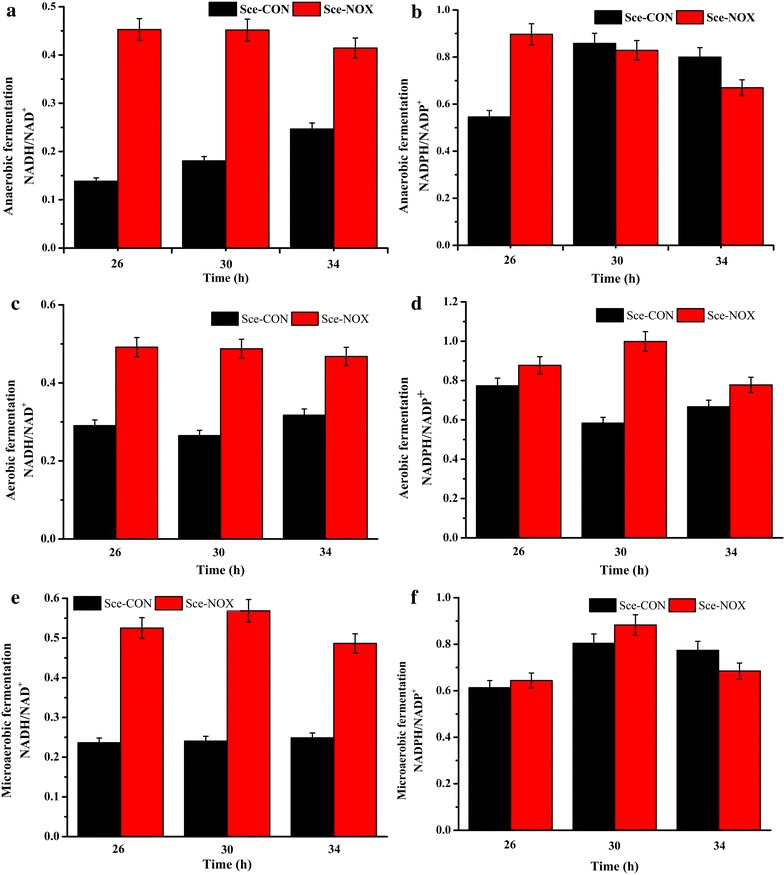
Fig. 2.

NADH/NAD+ and NADPH/NADP+ ratios of Sce-CON and Sce-NOX. In the batch fermentation in different oxygen supply models, the concentrations of the intracellular cofactors of Sce-CON and Sce-NOX at 26, 30, and 34 h were measured. a The NADH/NAD+ ratio in anaerobic fermentation; b The NADPH/NADP+ ratio in anaerobic fermentation; c The NADH/NAD+ ratio in aerobic fermentation; d The NADPH/NADP+ ratio in aerobic fermentation; e The NADH/NAD+ ratio in microaerobic fermentation; f The NADPH/NADP+ ratio in microaerobic fermentation
