
Fig. 3.
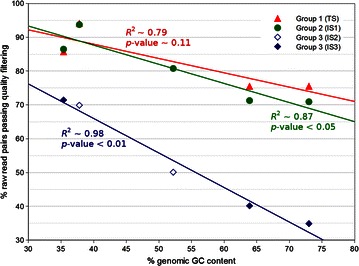
Impact of average library insert size and genomic GC content on sequencing quality. Genomic GC content was plotted against the percentage of raw read pairs passing quality filtering (80;20). Then, libraries were grouped according to their category. Group 1 (red) comprises all standard libraries (TS). Group 2 (green) covers all libraries of category IS1. Group 3 (blue) represents the combined set of IS2 and IS3 libraries