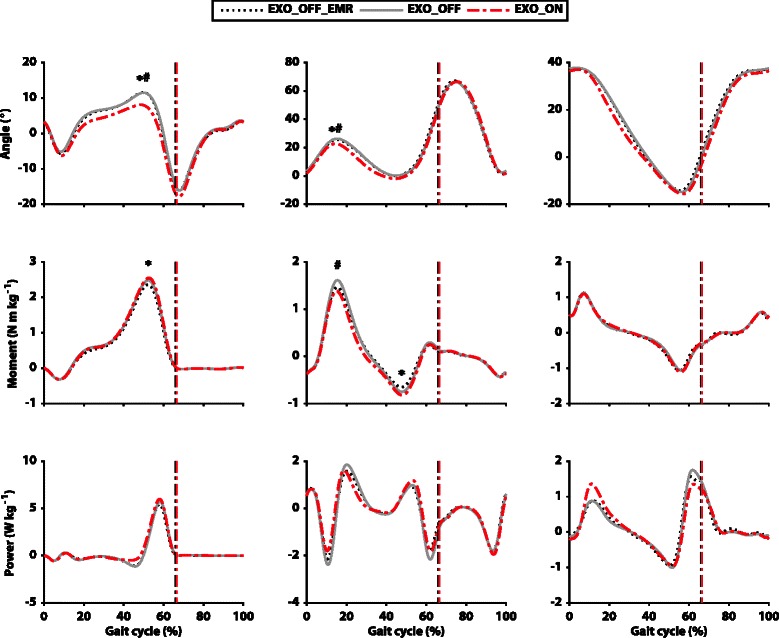
Fig. 7.

Joint kinematics and kinetics. Comparison of joint angles, moments and powers (top to bottom) for the three different conditions of testing across the gait cycle. The curves represent the three different conditions: EXO_OFF_EMR (dashed black), EXO_OFF (solid grey) and EXO_ON (dashed red). Ankle, knee and hip joints are displayed from left to right. Data are group means. The dotted vertical lines represent toe off. Positive joint angles represent flexion (dorsi-flexion at the ankle) and negative angles represent extension (plantarflexion at the ankle). Positive moments represent net extension joint moments (plantarflexion at ankle) and negative moments represent net flexion joint moments (dorsi-flexion at ankle). Positive powers represent instantaneous joint power generation and negative powers represent instantaneous joint power absorption. * Indicates significant difference (p < 0.05) with respect to the EXO_OFF_EMR condition, # indicates a significant difference (p < 0.05) with respect to the EXO_OFF condition
